This Microsoft Excel® spreadsheet pulls in five Imoku studies along with open, high, low, and close bar values. You can change the symbol and the time frame. You can retrieve up to 300 daily bars and up to 3,000 intraday bar values. The spreadsheet also allows you to use either the primary session or a custom session.
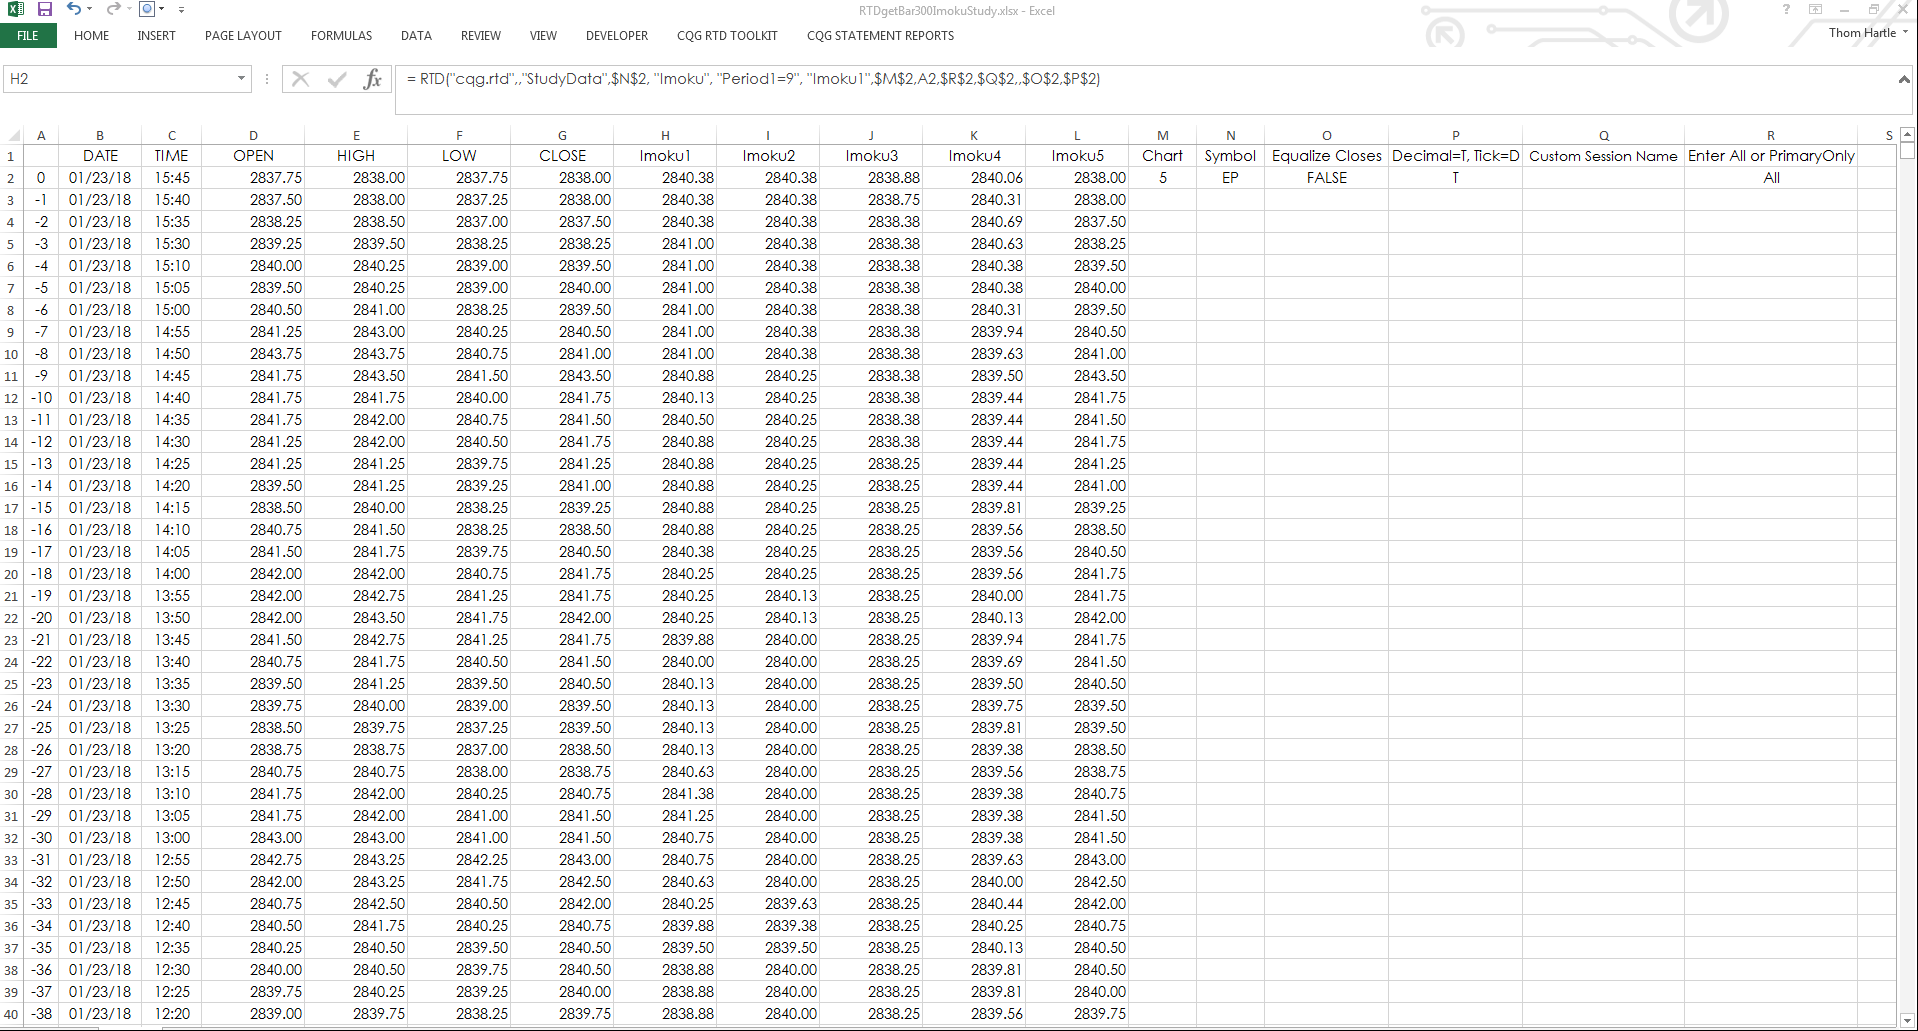
Here are the individual RTD formulas for each of the five Imoku studies using the EP symbol and the daily time frame:
Imoku1: = RTD("cqg.rtd",,"StudyData", "EP", "Imoku", "Period1=9", "Imoku1","D","0","ALL",,,"FALSE","T")
Imoku2: = RTD("cqg.rtd",,"StudyData", "EP", "Imoku", "Period2=26", "Imoku2","D","0","ALL",,,"FALSE","T")
Imoku3: = RTD("cqg.rtd",,"StudyData", "EP", "Imoku", "Period3=52", "Imoku3","D","-26","ALL",,,"FALSE","T")
Imoku4: = RTD("cqg.rtd",,"StudyData", "EP", "Imoku", "Period1=9,Period2=26,Period4=1,MAType4=Sim", "Imoku4","D","-26","ALL",,,"FALSE","T")
Imoku5: = RTD("cqg.rtd",,"StudyData", "EP", "Imoku", "MAType5=Sim,Period5=1,InputChoice5=Close", "Imoku5","D","0","ALL",,,"FALSE","T")
Requires CQG Integrated Client or CQG QTrader and Excel 2010 or higher.