This Microsoft Excel® dashboard pulls in the Short Sterling market data traded on the ICE platform. There are three forward curve charts. The first chart displays the quarterly contracts forward curves, the second chart displays the one-year calendar spreads forward curves, and the third chart displays the three-month calendar spreads forward curves.
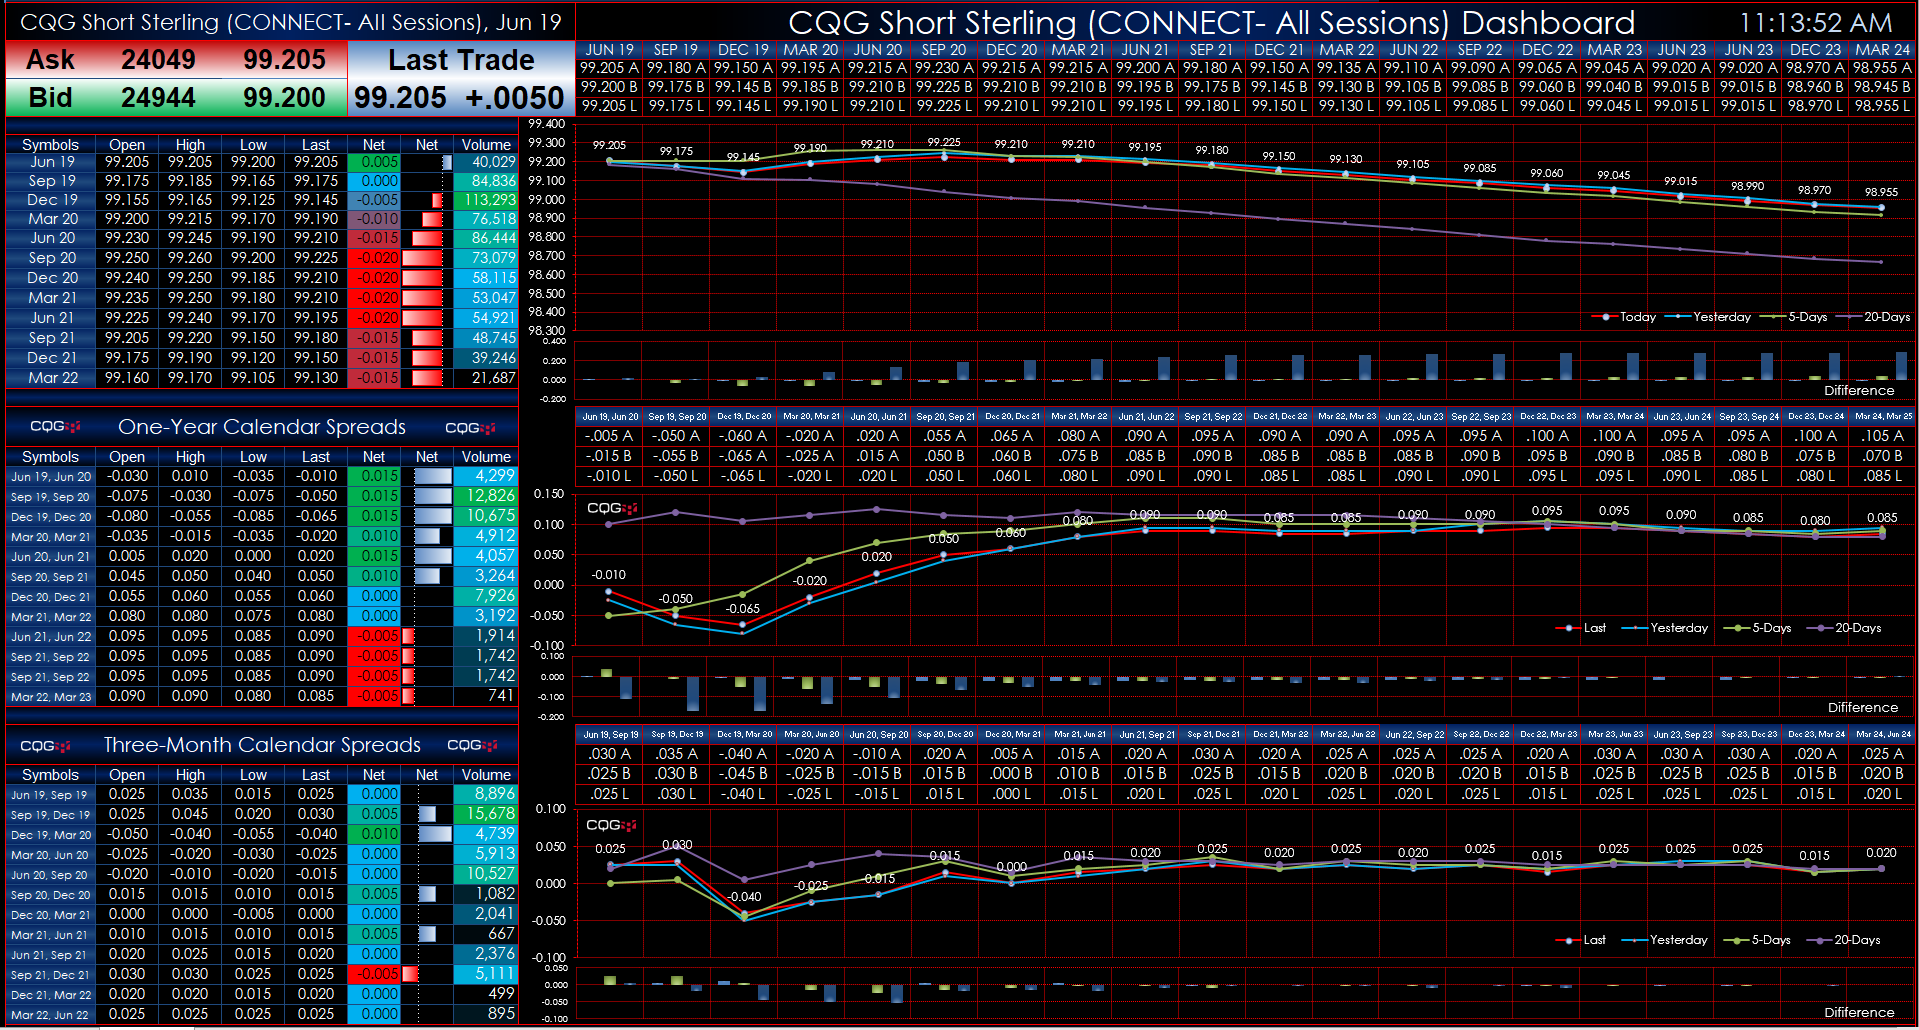
Each chart displays today’s forward curve, yesterday’s forward curve, the forward curve five days ago, and the forward curve twenty days ago. In addition, there is a histogram chart showing each forward curve's difference from today’s forward curve. There is the current best bid price, best ask price, and last trade directly above the each forward curves data point.
The left-hand side of the dashboard displays market data for the front contract and the next eleven contracts.
Requires CQG Integrated Client or QTrader, data enablements for all symbols displayed in these spreadsheets, and Excel 2010 or more recent.