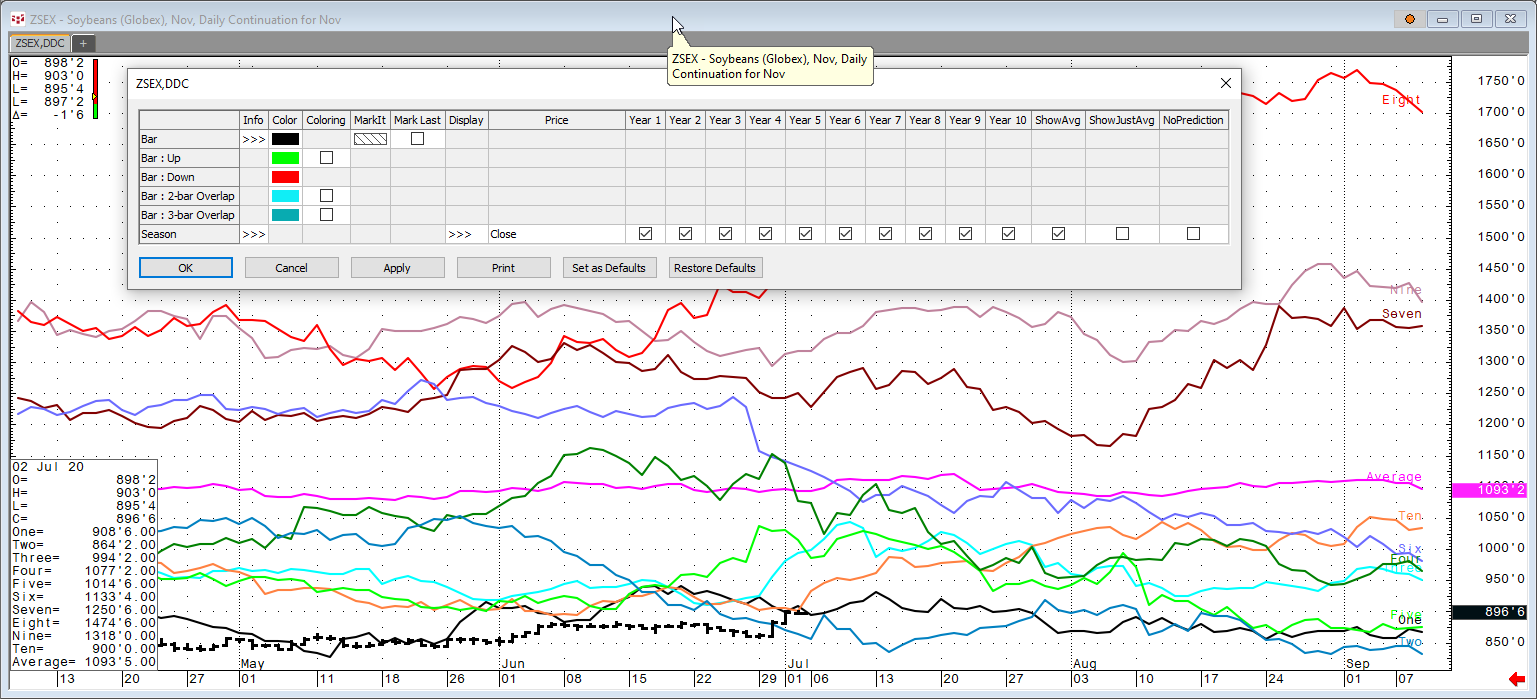
CQG’s Integrated Client and QTrader Version 2020 offers a new study called the Seasonal Study. This study is very popular with analysts and traders in the agricultural markets because of the annual nature of plantings, growing and harvesting crops. The theory is that history may repeat itself under similar conditions.
The Seasonal study applied to a chart will display the previous 10-years of daily trading activity by year as line charts. Now, you can compare the current trading activity for any similar historical activity. The study allows you to display just individual years and an average of all years. In addition, you can drag the chart to the left and see how the market activity unfolded.
The downloadable pac is a page that includes the chart with the Seasonal study applied that is linked to a quote board. In addition, there are four CQG Instrument Monitors also linked to the quote board. The Instrument Monitor tracks a single instrument across multiple timeframes and chart types with multiple studies and indicators in a spreadsheet view. In this case the instrument monitors are performing correlation analysis over set lookback periods for each historical year compared to the current year. The Instrument monitor is not heat mapped.
The set lookback periods are:
- 20-day lookback
- 50-day lookback
- 100-day lookback
- 200-day lookback
Now, you can easily identify which previous years the current year’s trading activity may be tracking.
Requires CQG Integrated Client Version 2020 or CQG QTrader Version 2020 or higher.
