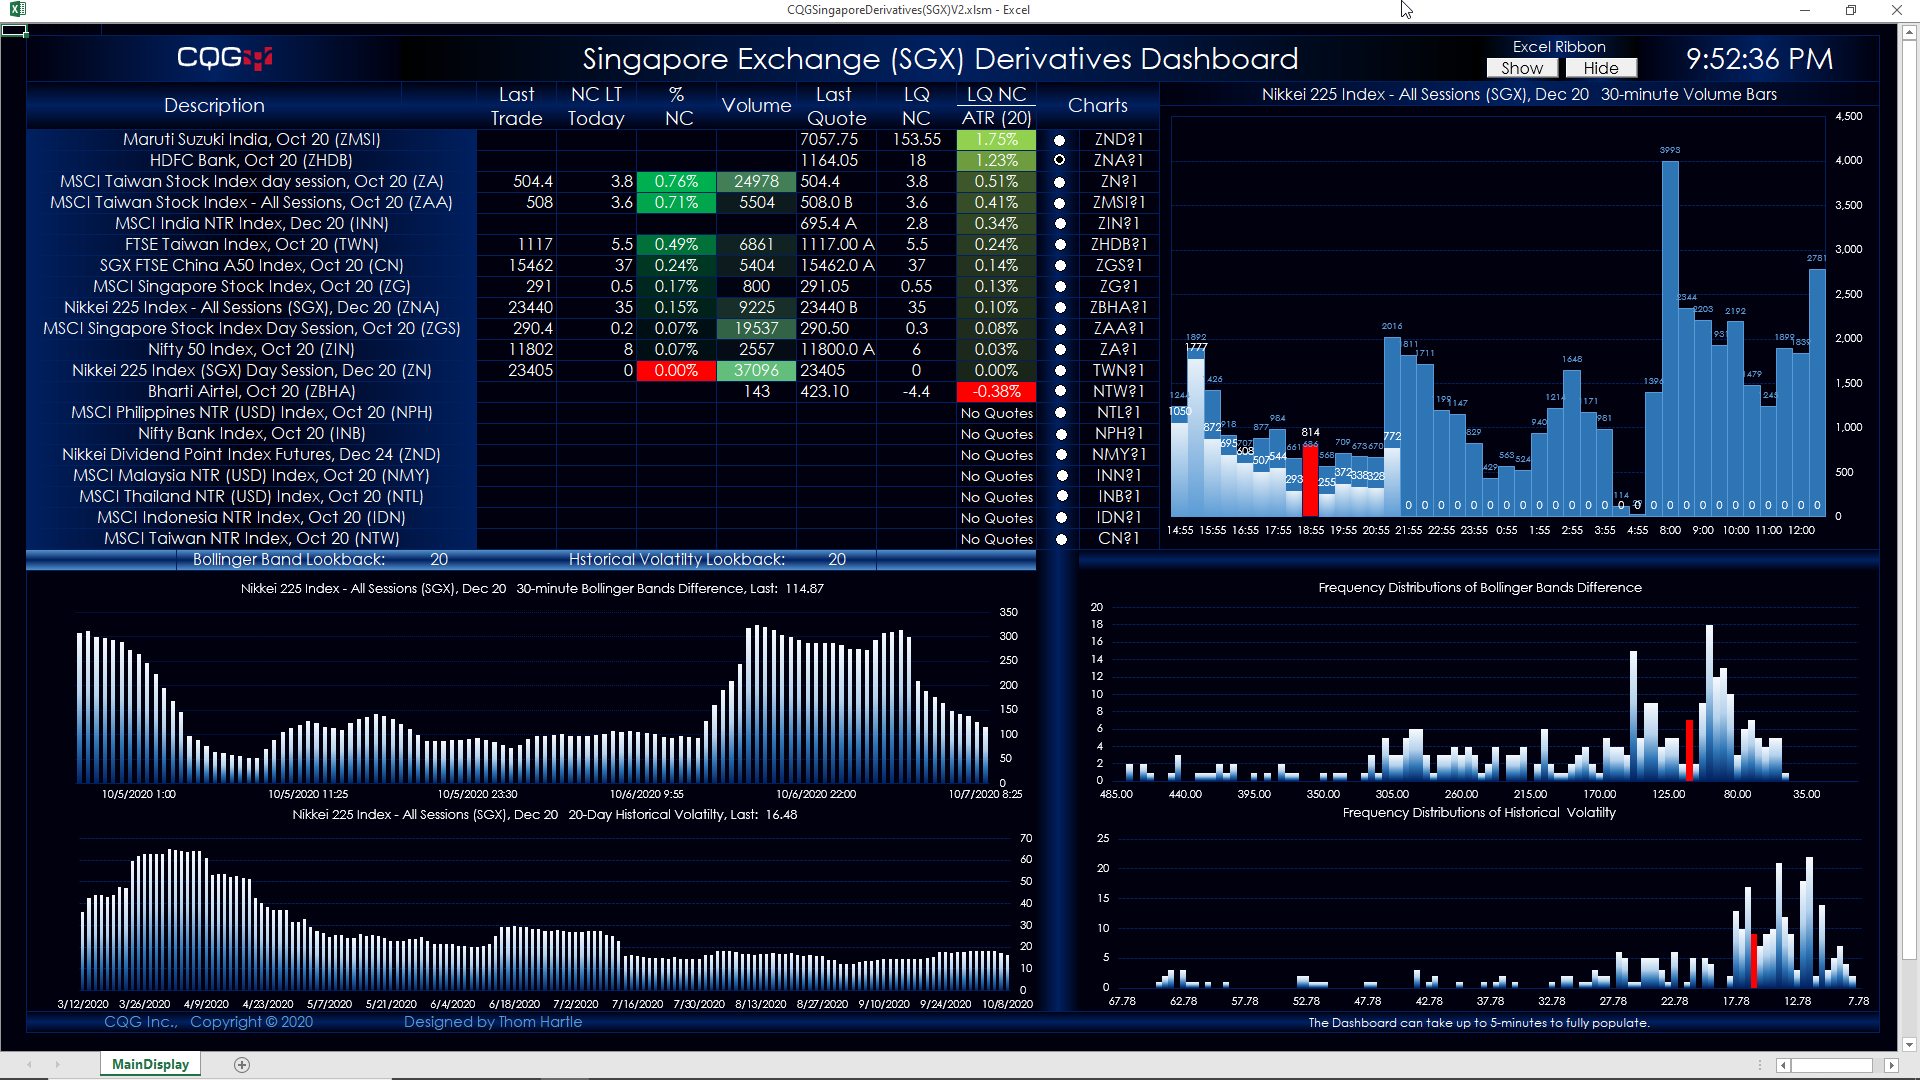
This Microsoft Excel® dashboard tracks the futures contracts traded on SGX. The symbol choices are hard coded and are the most popular by volume and open interest.
This dashboard pulls in a large amount of volume data and may take up to five minutes to fully load. Once the volume data is loaded then the dashboard prices will update normally. By preloading the historical volume data the volume charts will update immediately.
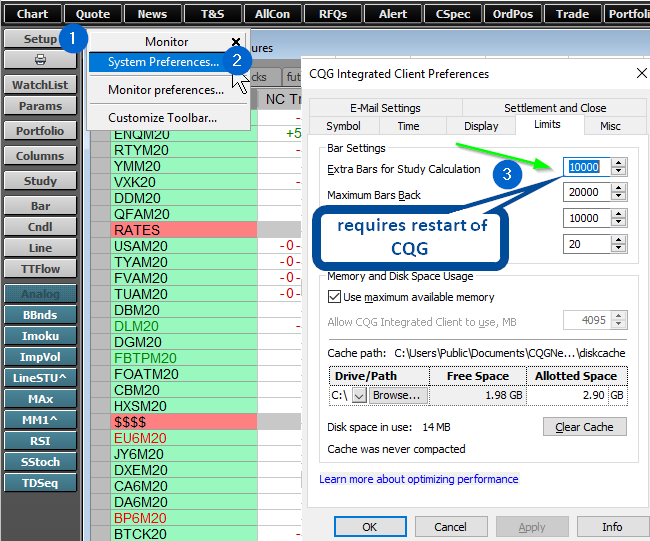
There is one required adjustment to CQG and that is to increase the “Extra Bars for Study Calculation.” Go to “Setup/System Preferences/Limits and increase the Extra Bars for Study Calculation to 10,000. You are required to restart CQG.
There are some unique features regarding this dashboard. Here are the details.
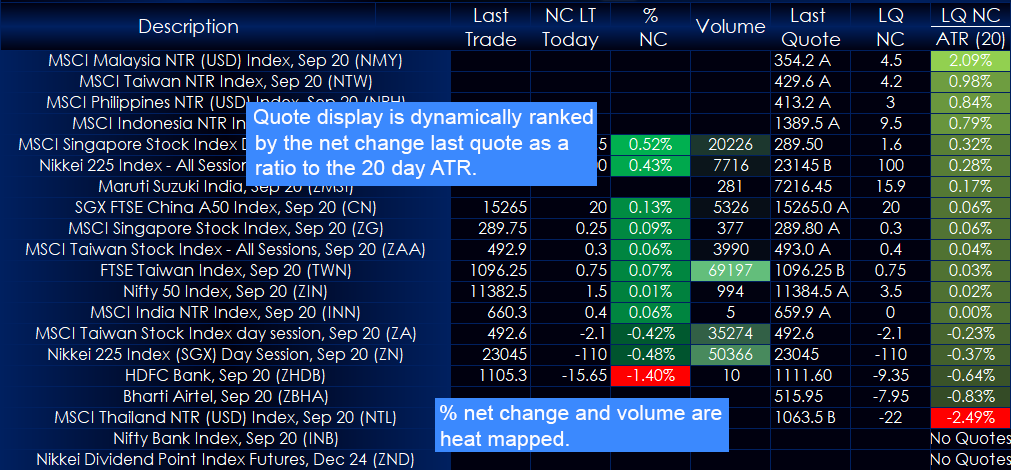
First, the quote display is dynamically ranked by the last quote net change as a ratio to the 20-day Average True Range study. This normalizes the last quote net change and gives the user a better sense of market movement then using percent net change. In addition the volume is heat mapped.
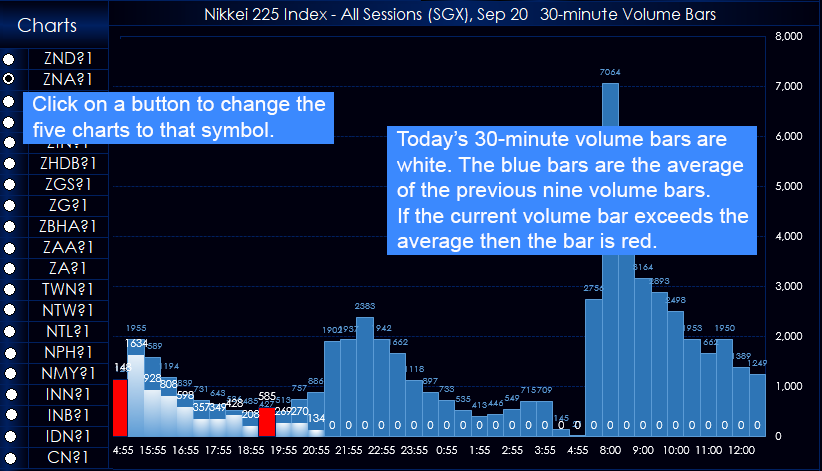
The chart is a 30-minute volume chart for the current session. Click on the radio button next to the symbol to change the chart. The current session’s volume is a white histogram bar. The blue histogram bars are the previous 9-bar volume average. If the current 30-minute volume exceeds the previous 9-bar average then the current volume histogram bar is red. Now, you can easily spot high volume periods.
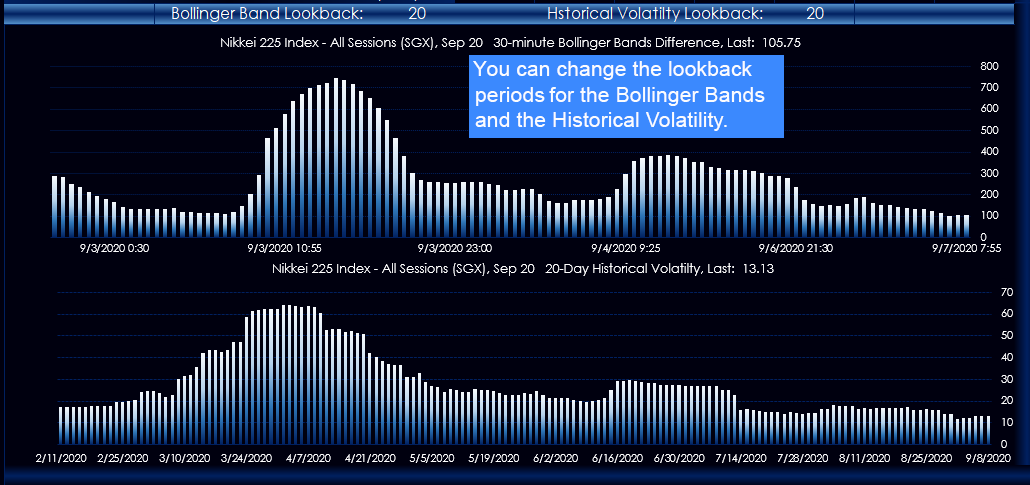
The 30-minute Bollinger Band difference study and the 20-day historical volatility study are studies to spot low and high volatility. You can set the lookback periods for both studies.
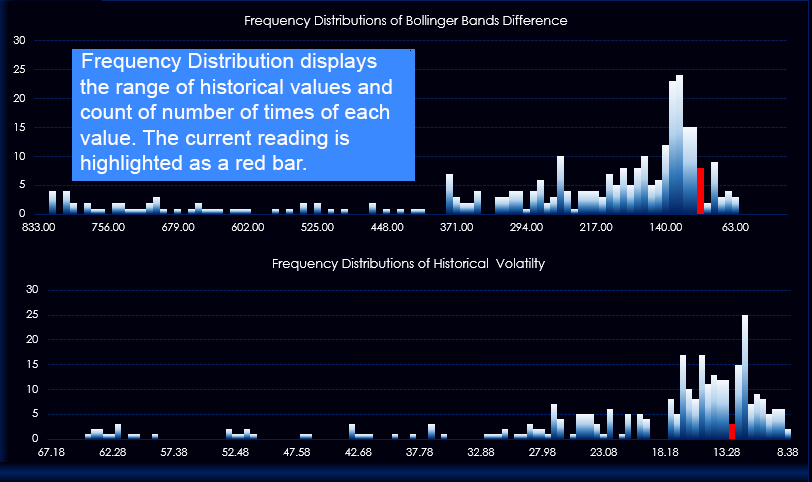
Frequency distribution charts display the observations or occurrences of values detailing both the range and the count of occurrences. The horizontal axis are bins that are discrete ranges, such as 0 to 1.5, 1.6 to 3.0, etc. The current value of the study is colored red. With a quick glance you can see where the current study value is relative to the range of values. Learn more about frequency distribution here.
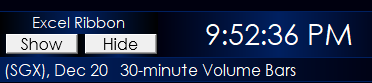
One last feature is the macro buttons that will hide or show the Excel ribbon. This allows for better use of screen real estate. Before closing the Excel worksheet please click Show.
Requires CQG Integrated Client or QTrader and data enablements for the products. Strongly recommended: Microsoft Office Professional Excel 2016, 2019, 32 or 64-bits installed on your computer, not in the Cloud.