This post expands on the use of Microsoft® Excel function “CountIF.” The CountIF functions was detailed in the post “Dynamic Ranking in Excel” as a method for dealing with ties when ranking various markets’ performance based on percentage net change. Here, we will use the CountIF function as a technique to look up market symbols (text) that are used multiple times in the same column.
The example is using the companies that comprise the portfolio that are referred to as the FAANG group: Facebook (symbol: FB), Amazon (symbol: AMZN) Apple (symbol: AAPL), Netflix (symbol: NFLX) and Alphabet (formerly known as Google, symbol: GOOG).
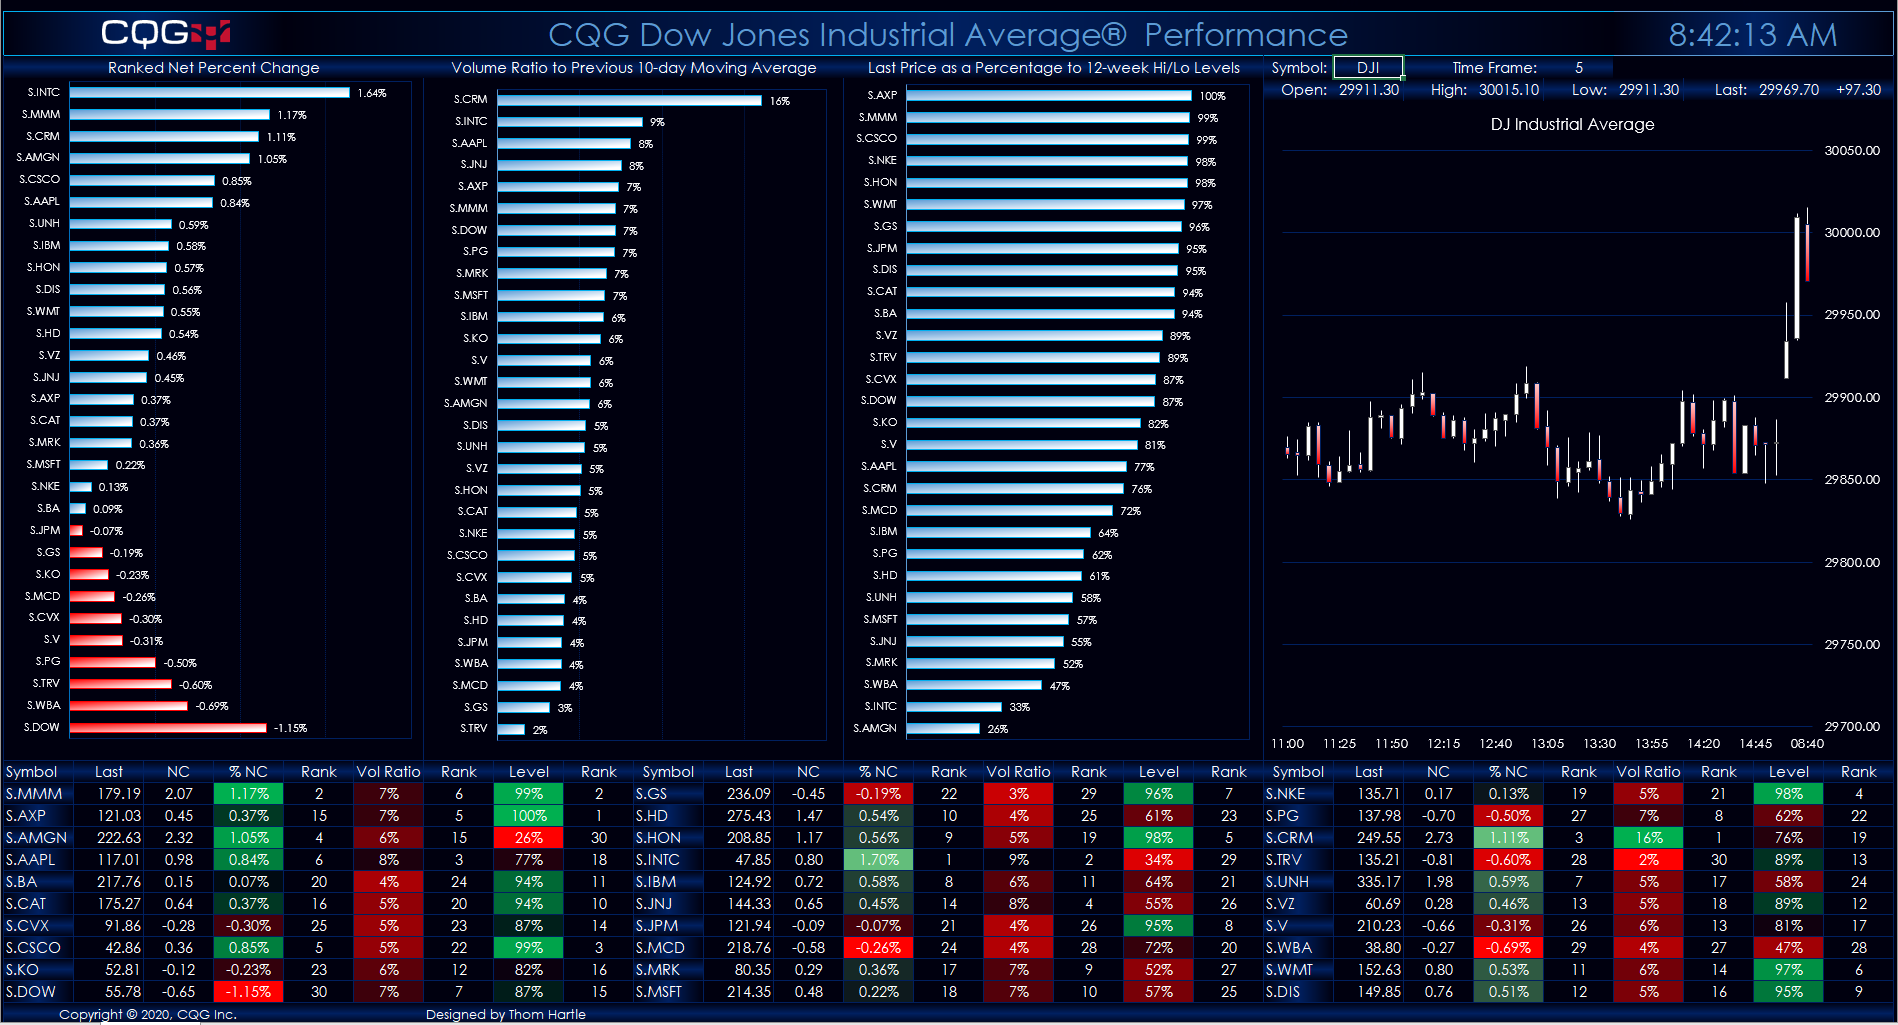
There are three sets of RTD functions used for each symbol: percent net change last trade, today’s volume as a ratio to the previous 10-day average of volume (the previous value is a fixed value and will not be effected by today’s trading activity) and finally, today’s last price as a ratio to the previous 12-weeks high low range. Readings above 50% indicate the last price is in the upper half of the 12-week range and readings below 50% indicate the last price is in the lower half of the 12-week range. This analysis uses a CQG function named “Level” and was detailed in the post: NASDAQ-100 Index Members Performance
Here is a list of the RTD formulas used in the downloadable sample. Notice that:
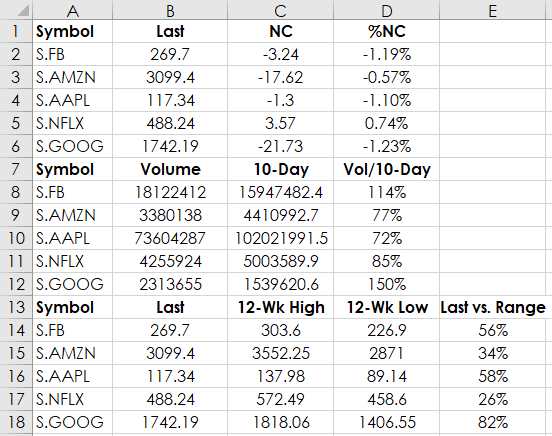
The RTD formula for percent net change last trade (the symbols are in cells A2:A6):
=RTD("cqg.rtd", ,"ContractData",A2, "PerCentNetLastTrade",, "T")/100The RTD formulas for the volume ratio uses two functions (the symbols are in cell A8:A12):
=RTD("cqg.rtd", ,"ContractData",A8, "T_CVol",, "T")= RTD("cqg.rtd",,"StudyData",A8, "MA", "InputChoice=Vol,MAType=Sim,Period=10", "MA","D","-1","all",,,,"T")The RTD formulas for today’s last price as a ratio (the last Excel formula in the list) to the previous 12-weeks high low range uses four formulas (the symbols are in cell A14:A18):
=RTD("cqg.rtd", ,"ContractData",A14, "LastTrade",, "T")=RTD("cqg.rtd",,"StudyData","HiLevel("&A14&",Period1:=12,AllowGaps:=0,InputChoice1:=High,InputChoice3:=High)","Bar",, "Close","W","0",,,,,"T")=RTD("cqg.rtd",,"StudyData","LoLevel("&A14&",Period1:=12,AllowGaps:=0,InputChoice2:=Low,InputChoice4:=Low)","Bar",, "Close","W","0",,,,,"T")=(B14-D14)/(C14-D14)
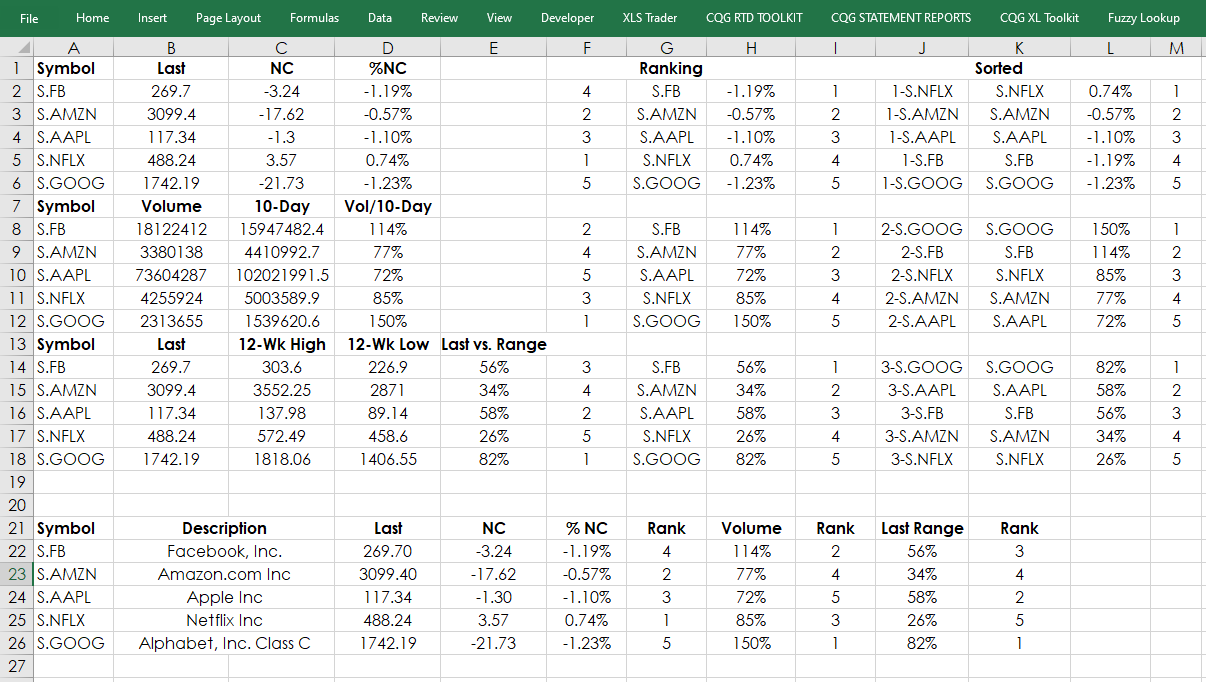
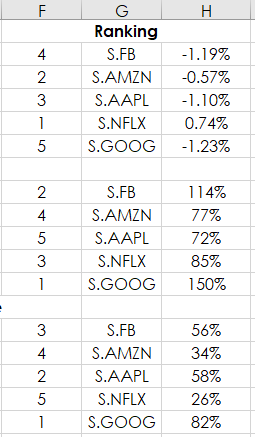
In the sample spreadsheet each of the individual stocks in the three groups of the RTD functions are individually ranked within the group using in column F:
=RANK(D2,$D$2:D$6,0)+COUNTIF($D$2:D2,D2)-1
Columns K and L use VLookup to pull the symbol and the statistic from the ranked returns sorted from 1 to 5.
=IFERROR(VLOOKUP(I2,$F$2:H$6,2,FALSE),"")
We have three sets of studies that are ranked by performance. The sample spreadsheet displays the studies by symbols in one group at the bottom.
There is a challenge to making this display. If you want to look at the three RTD studies for one symbol then VLookup by symbols will not work. Using VLookup searching for “FB” will only return one value, not all three study values. When only looking at five symbols a fairly simple method could be used using IF Then functions, but if the portfolio was 30 stocks, such as the Dow Jones Industrial Average then a more efficient solution is available by using the CountIF function.
Column J uses the following Excel function for all of the symbols in column K:
=COUNTIF($K$2:K2,K2)&"-"&K2

This formula when copied down returns the number of times a symbol is used and that value is merged with the symbol. You see 1-S.FB 2-S.FB 3-S.FB in the three groups because symbol FB appears three time. Now, VLookup will find all three symbols and return the values generated by the RTD functions.
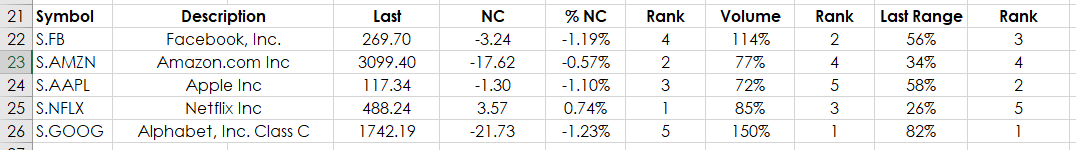
For example, in cell F22 the text “1-“ is merged with the symbol in cell A22. VLookup can locate “1-FB” in the table J2 by L18 and return the value 3 columns over.
=VLOOKUP("1-"&$A22,$J$2:$L$18,3,FALSE)This table combines the data. For example, at the time of this writing Google or Alphabet was the weakest performer (Rank = 5) and the Volume Ratio was the highest at 150% (Rank = 1). However, the last price was 82% of the 12 week range (Rank = 1).
The above functionality is the backbone of the CQG DJIA Performance Dashboard. Three charts are displaying the current readings of the ranked performance of the 30 component stocks, plus an individual chart is available.