If you track the performance of ETFs you may be interested in evaluating the performance of the stocks that are held by the ETF, such as the Invesco QQQ ETF, which tracks the Nasdaq-100 Index. Two downloadable samples are provided at the bottom of this post, one is for QQQ and the second is ARKK.
Why would this information be helpful? Hedge Fund manager Jonathan Hoenig in his book Price is Primary has this chart below detailing that losses require a substantial gain to get back to breakeven, such as a 50% loss requires a 100% gain.
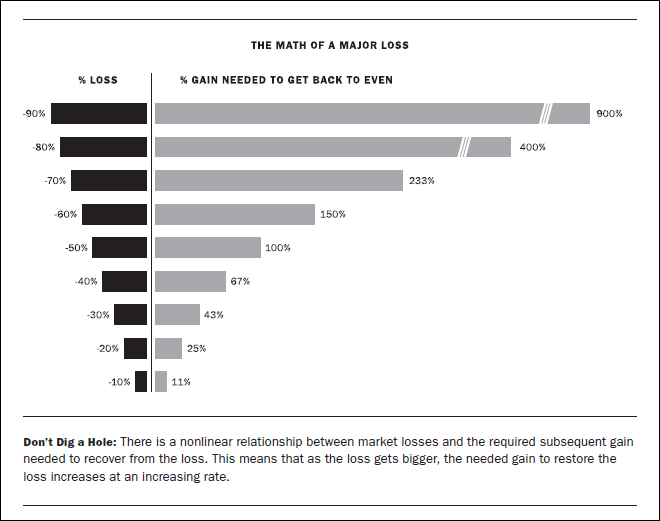
Chart courtesy of Price is Primary by Jonathan Hoenig (2021), page 92, due out August 1, 2021.
Most ETF sites make available a downloadable either Excel or CSV file of the stocks in the ETF. It is recommended that you merge “S.US.” to the stock symbol. Only two Excel RTD calls are required: one for the high for the year and one for the last trade. Assume the symbols are in column A.
= RTD("cqg.rtd",,"StudyData",A2, "Bar", "", "High","A","0",,,,,"T")= RTD("cqg.rtd", ,"ContractData",A2, "LastTrade",, "T")
Then simply subtract the annual high from the last trade and divide by the annual high.
Here is an image of the Excel Dashboard for symbol QQQ (please click on it to enlarge it). The symbols are as of 5/7/21.
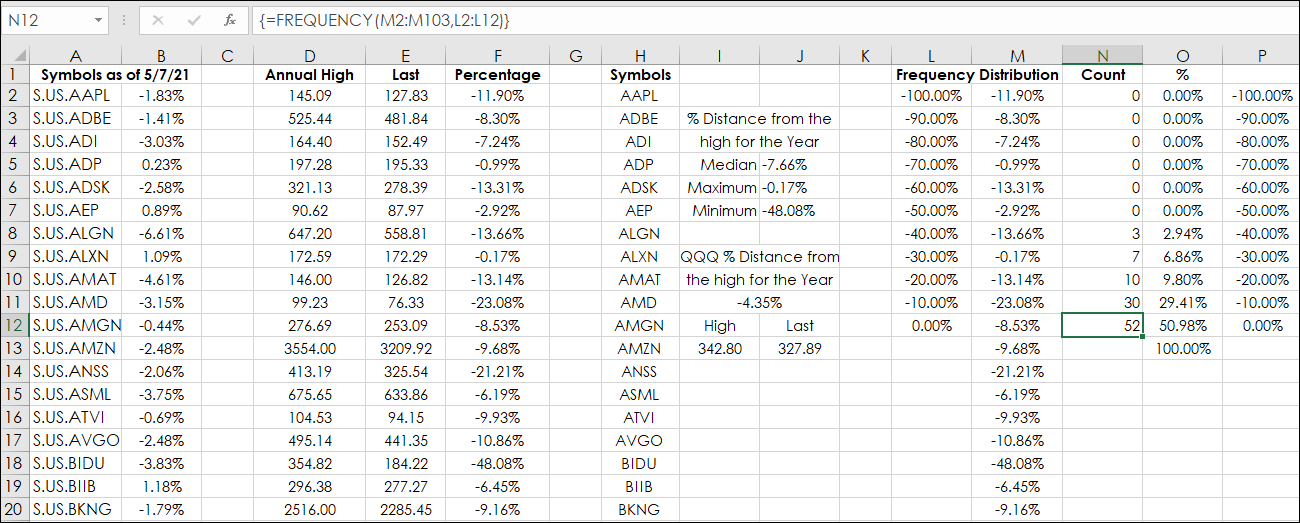
Column H is a simple symbol column for labeling the histograms in the chart. Columns L through N is using Excel’s frequency distribution analysis. Here is a link to the Excel Help file. Column L is the percentage bins. Column M is the data. Column N is the count of occurrences. For example, there were 52 occurrences of reading between 0% and up to but not including -10%. This helps in understanding the range of the outcomes.
There are two tabs: Data and chart.
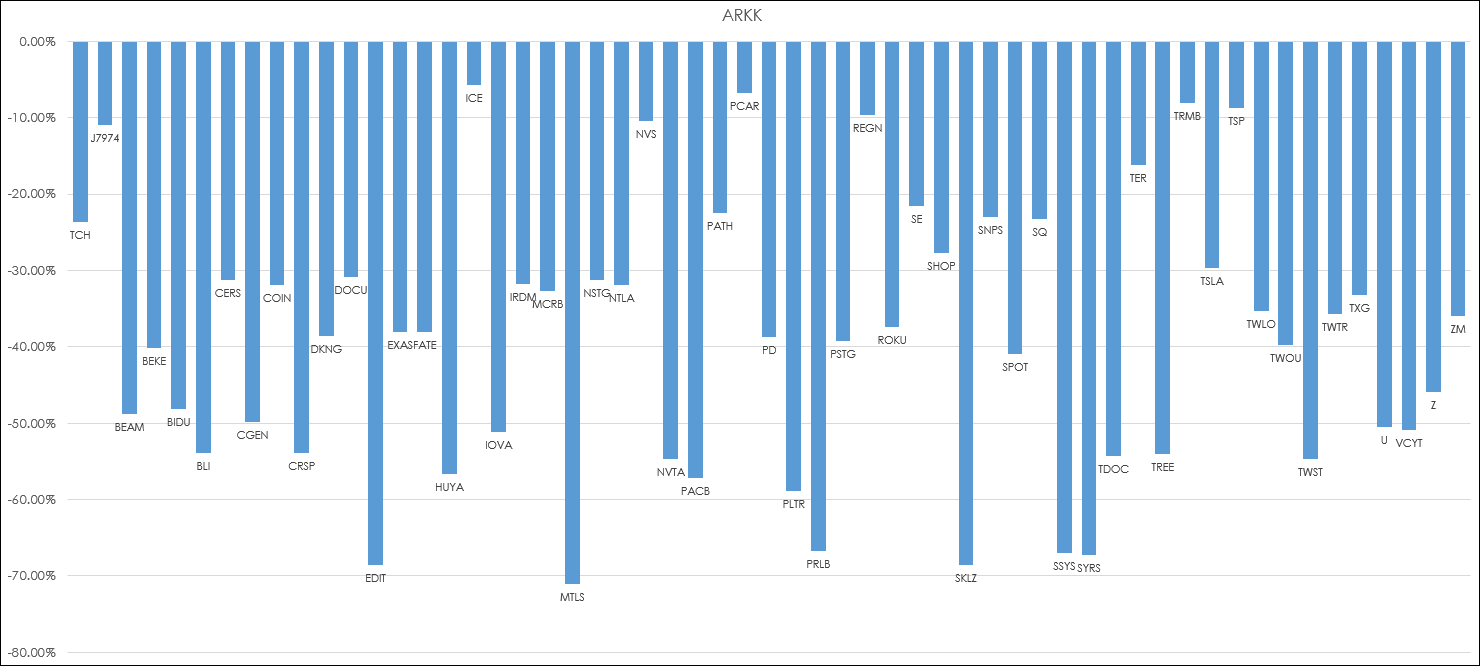
The second downloadable dashboard uses the holdings for symbol ARKK (ARK Innovation ETF). Please note for the company Tencent Holdings LTD the futures contract symbol is used, which trades in Honk Kong dollars, but we are using percentage differences and therefore no adjustment is necessary. Also, the symbol for Nintendo Co, Ltd., is S.JP.J7974.
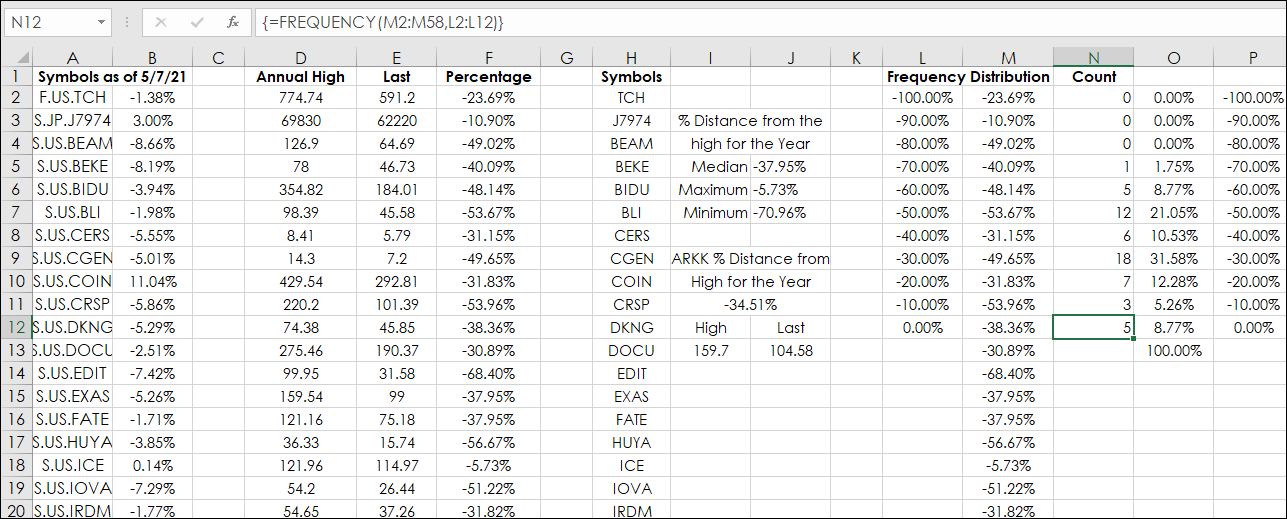
Notice above that only five stocks above in the frequency distribution analysis have a count of 0% and up to but not including 10%.
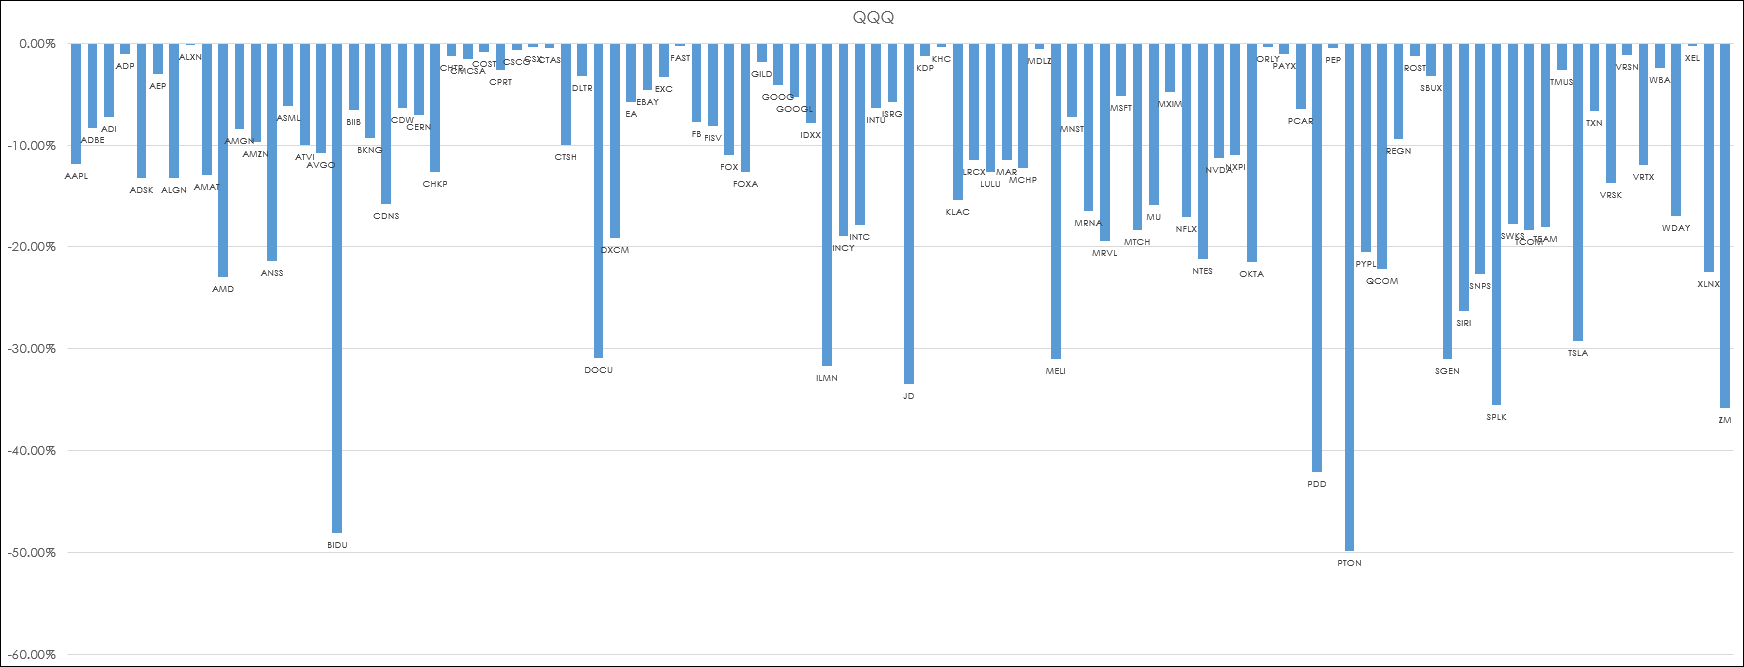
Here is the chart for AARK:
To use these dashboards simply replace the symbols in column A and adjust the frequency distribution and chart ranges accordingly.
Requires CQG Integrated Client or QTrader and exchange enablements. Strongly recommended: Microsoft Office Professional Excel 2016, 2019, 32 or 64-bits installed on your computer, not in the Cloud.