This Microsoft® Excel Dashboard pulls percent net change for the current session for twelve different markets.
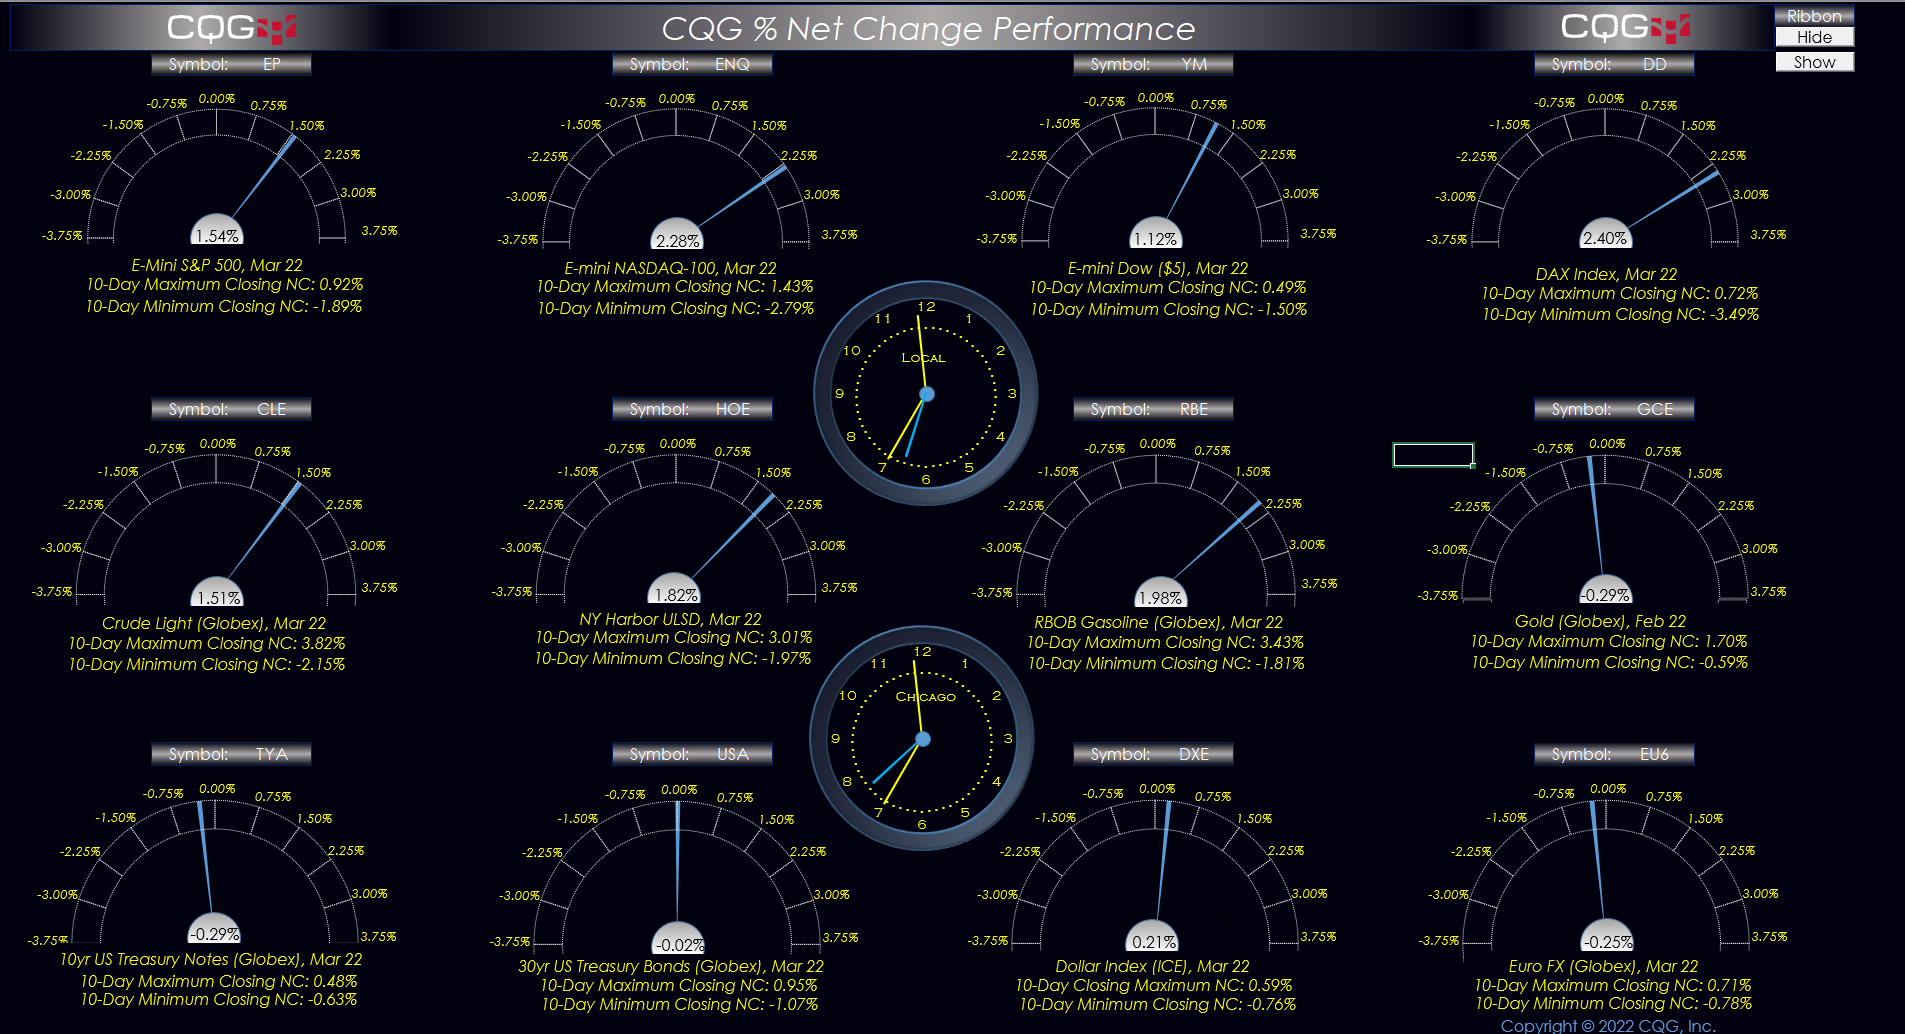
Next to “Symbol:” you can enter in your favorite symbol. Be sure and use all capital letters.
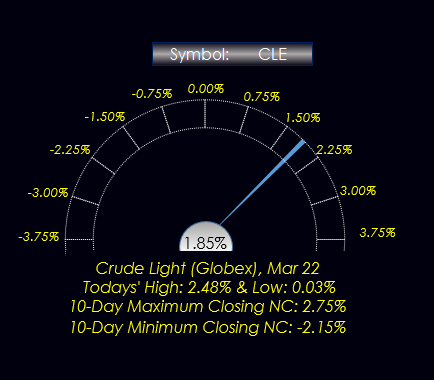
This dashboard is unique in that it uses a “speedometer” style display for the current percent net change value for each market. A simple glance and easily discern the winner and losers and by how much.
Below each chart display is the contract description, today's high percent net change and today's low percent net change, and the largest percent net change in the previous 10-sessions and the lowest percent net change.
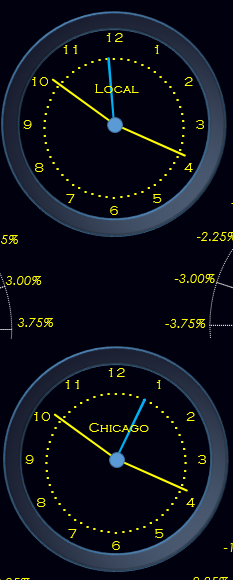
The center of the dashboard displays two analog clocks: One is local time and the second is Chicago time.
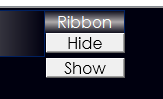
Finally, you can choose to hide the Excel ribbon for better screen real-estate management or show the ribbon. Before closing the dashboard click on “Show”.
Two Excel Dashboards are available: One displays the percent net change values and the second first ranks the percent net change and displays the data with the highest performing market in the top left-hand corner down to the lowest performing market in the bottom right-hand corner. The second one comes prepopulated with Sector ETFs, but you can enter in your own symbols.
Requires CQG IC or QTrader and Excel 2013 or higher installed on your computer, not in the Cloud.