Monitoring market data in Excel may be enhanced by including Forward Curve charts. However, there are issues with Excel charting and the purpose of this post is to offer solutions using Excel functions.
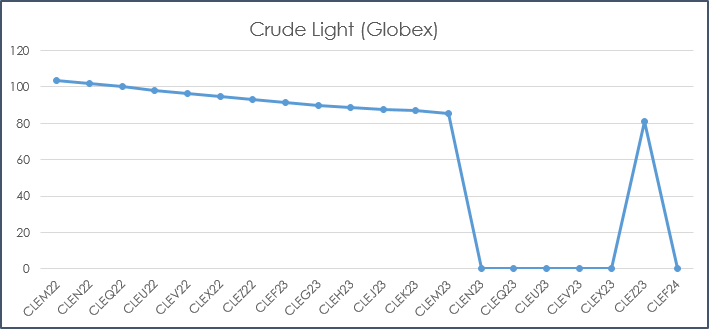
For example, if the “Last Trade” for Crude Oil is being pulled into Excel then there might be blank cells in the deferred contracts and Excel interprets that as zero and the chart will look like this:
Before we delve into the first solution for this chart we will walk through the basic details of the downloadable sample spreadsheet at the bottom of the post. First, cell A3 is where to enter the symbol.
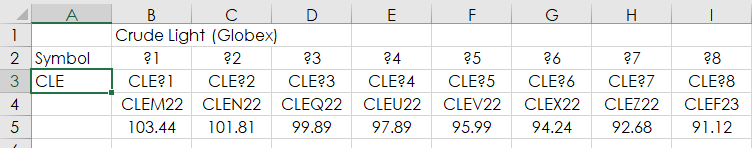
Row 2 has the wildcard symbols out to ?20. Row 3 merges the wildcard symbols with the symbol from cell A3. Row 4 returns the actual symbol and row 5 returns the Last Trade Today.
=RTD("cqg.rtd", ,"ContractData",B3, "Symbol",, "T")
=RTD("cqg.rtd", ,"ContractData",B3, "LastTradeToday",, "T")
One solution to cleaning up this chart above is to use an If Then function to return the error #N/A if there is no price. When Excel sees the #N/A error it skips the cell in the chart.
=IF(RTD("cqg.rtd", ,"ContractData",B3, "LastTradeToday",, "T")="",NA(),RTD("cqg.rtd", ,"ContractData",B3, "LastTradeToday",, "T"))
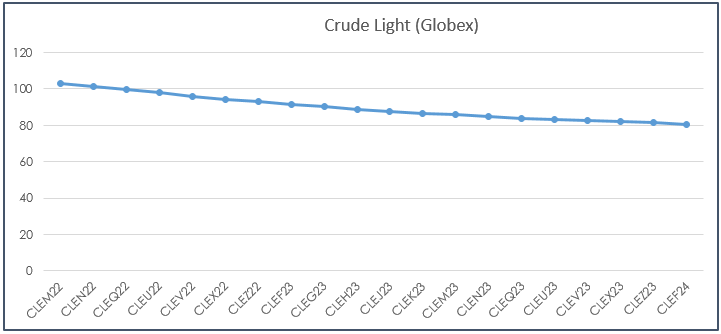
The formula uses NA() and returns #N/A if the cell is blank. Here is the updated chart using the #N/A error.
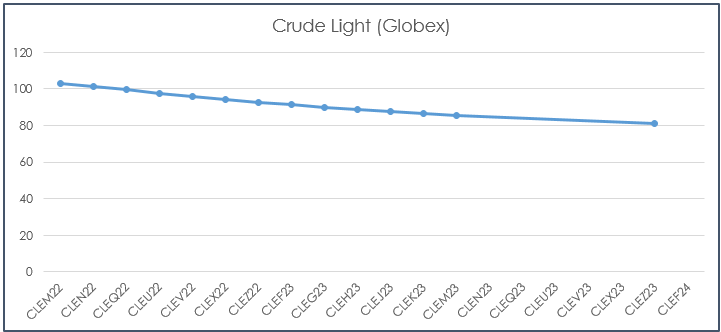
You can see in the chart above that there are no points highlighted on the line when there is no last trade and also the line stops at CLEZ23 because there is no value for CLEH24.
The above solution is an improvement but another issue could be the Last Trade price is old relative to the more active front contracts. In fact, the Last trade could be outside the current Bid and Ask. Here, the solution is to have Excel check whether the Last Trade is outside the Bid or Ask and if True then return the median of the bid and ask.
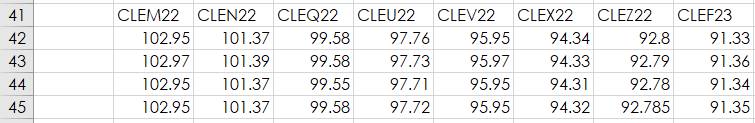
The RTD call for the Last Trade is in row 42, the RTD call for the Ask is in row 43, the RTD call for the Bid is in row 44 and the comparison is in row 45.
=RTD("cqg.rtd", ,"ContractData",B41, "Ask",, "T")
=RTD("cqg.rtd", ,"ContractData",B41, "Bid",, "T")
=IFERROR(IF(OR(B42>B43,B42
Here is the chart using row 45:
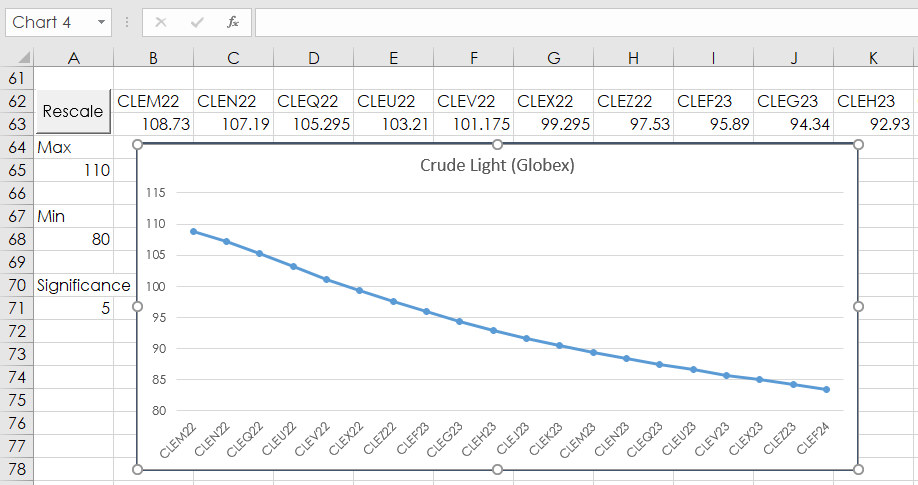
One last issue is Excel tends to default to 0 for the bottom of the price axis. A short Macro with an additional two Excel functions to determine the Maximum and Minimum values for the price axis allows you to rescale the price axis of the chart.
{=CEILING(MAX(IFERROR(B63:U63,"")),A71)}
{=FLOOR(MIN(IFERROR(B63:U63,"")),A71)}
The top function determines high price for the axis and the bottom function determines the low price for the axis used in the macro. The two functions round the number to the nearest significance, which is referenced in cell A71. For lower priced markets, such as Natural Gas, you could enter 2 into cell A71.
The MAX and MIN functions include the IFERROR function which replaces an error, such as #N/A, with a space as the #N/A error would result in an error being returned for CEILING and FLOOR.
Notice the two formulas are surrounded by curly brackets {}, When using these two functions you have to enter it as an array. That is you select the range of cells, such as B63:U63 and place you cursor after the end of the function and use the key combination Crtl+Shift+Enter and the curly brackets are added by Excel.
To use the macro below you need to know the name of the chart. Simply select the chart and use what is displayed in the top left-hand corner of Excel.
Sub RescaleChart()
With Worksheets("Sheet1").ChartObjects("Chart 4").Chart.Axes(xlValue)
    .MaximumScale = Worksheets("Sheet1").Range("A65")
    .MinimumScale = Worksheets("Sheet1").Range("A68")
End With
End Sub
This article walked you through a few tricks to making Excel a better product for you.
To learn how to add a button in Excel and link a macro to the button please visit Microsoft Support.