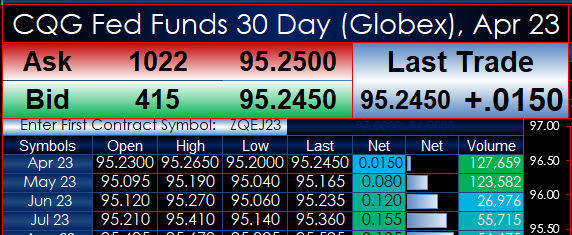
This Microsoft Excel® macro enabled dashboard pulls in the 30-Day Fed Funds market data traded on the CME Globex platform.
The Dashboard enables the user to enter in the symbol for the first contract. Use: ZQE+Month+2 digit year, such as ZQEJ23.
There are three forward curve charts. The first one displays the monthly contracts forward curve, the second display is the user selected calendar spreads forward curve, and the third chart displays the user selected calendar spreads forward curve.
Each chart displays today’s forward curve, yesterday’s forward curve, the forward curve 5-days ago, and the forward curve twenty days ago.
In addition, there is difference histogram chart showing each forward curves difference from today’s Forward Curve. There is the current best bid price, best ask price and last trade directly above the each forward curves data point.
The two calendar spread forward curves have a drop down menu so the user can select the calendar spreads to view.
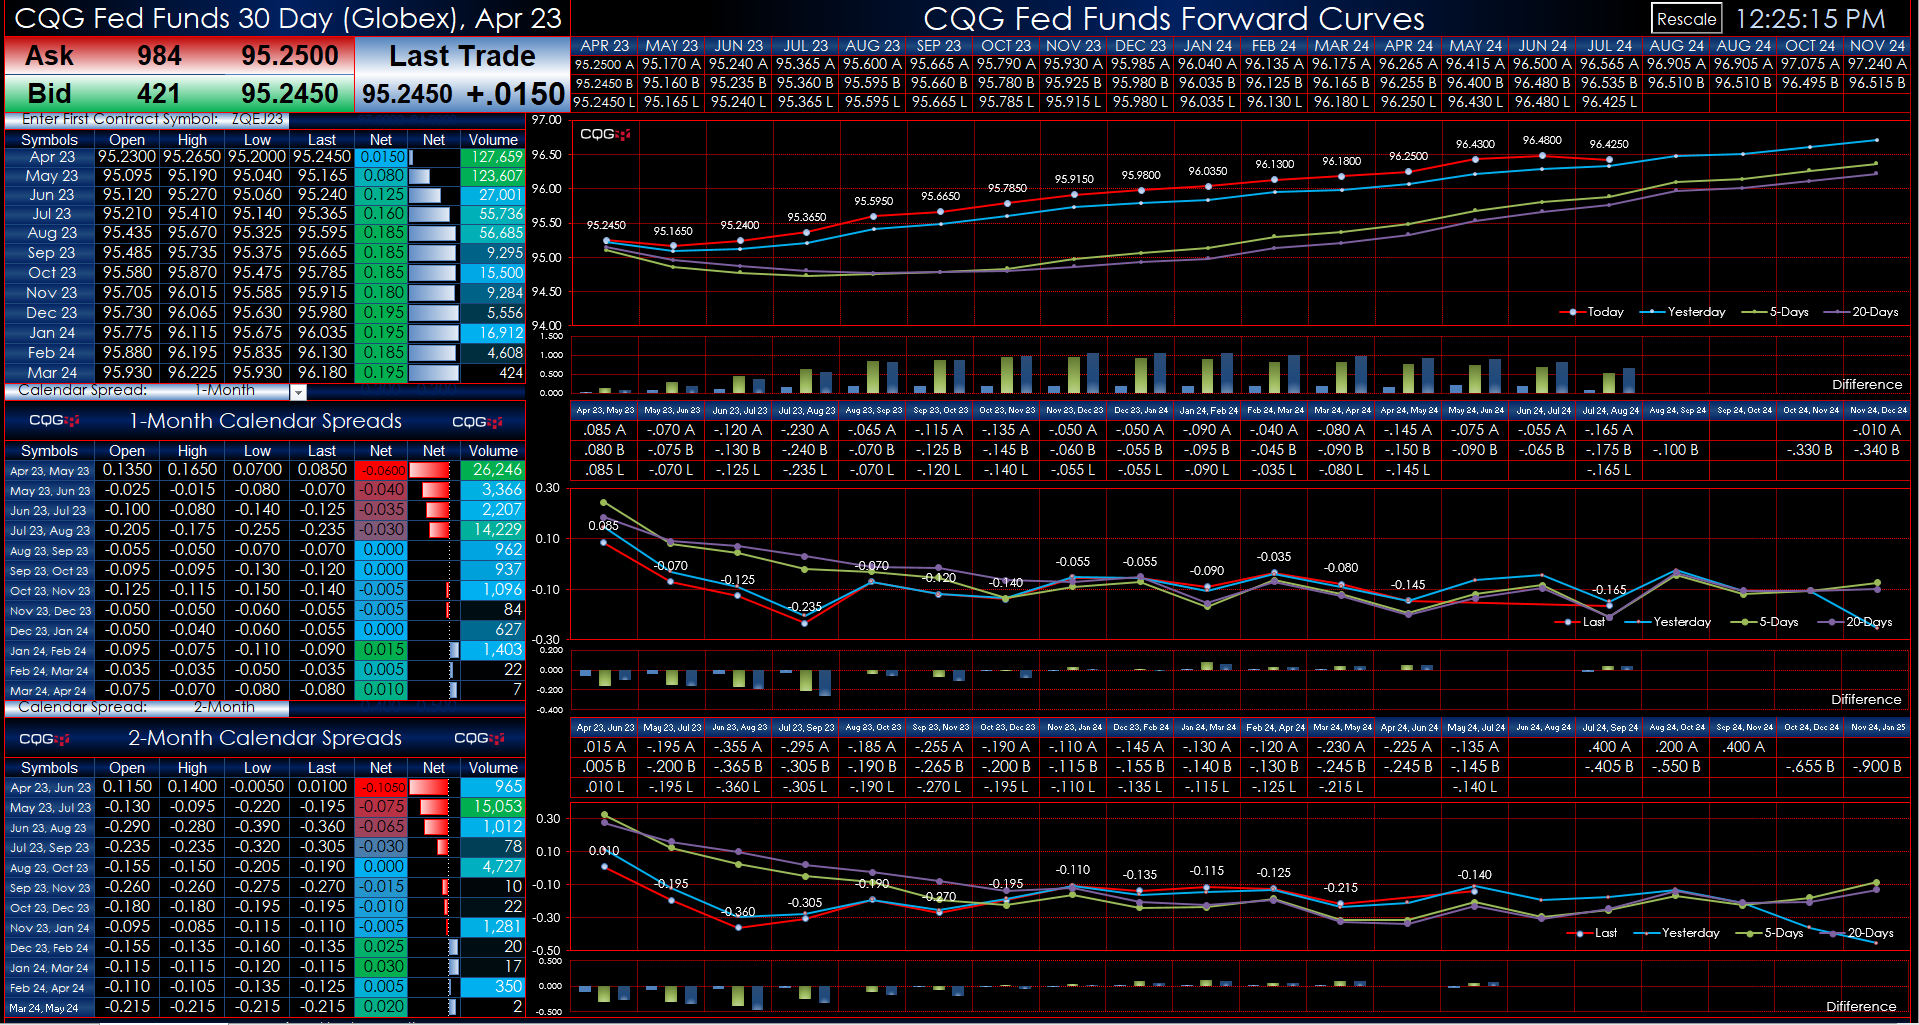
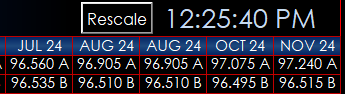
If the current data prices exceeds the maximum or minimum price scale (Y-axes) the button “Rescale” will run a macro that reviews the current price data and sets the chart price axes to the correct scale.
The left-hand side of the dashboard displays market data for the front contract and the next eleven contracts.