The Portfolio monitor is a combination market quotes and study values display. In addition, the Portfolio monitor can display the status of conditions, such as a study has hit an overbought level for an oscillator study.
The easiest way to build a Portfolio Monitor is to start with a chart. Add all of the studies and conditions to the chart.
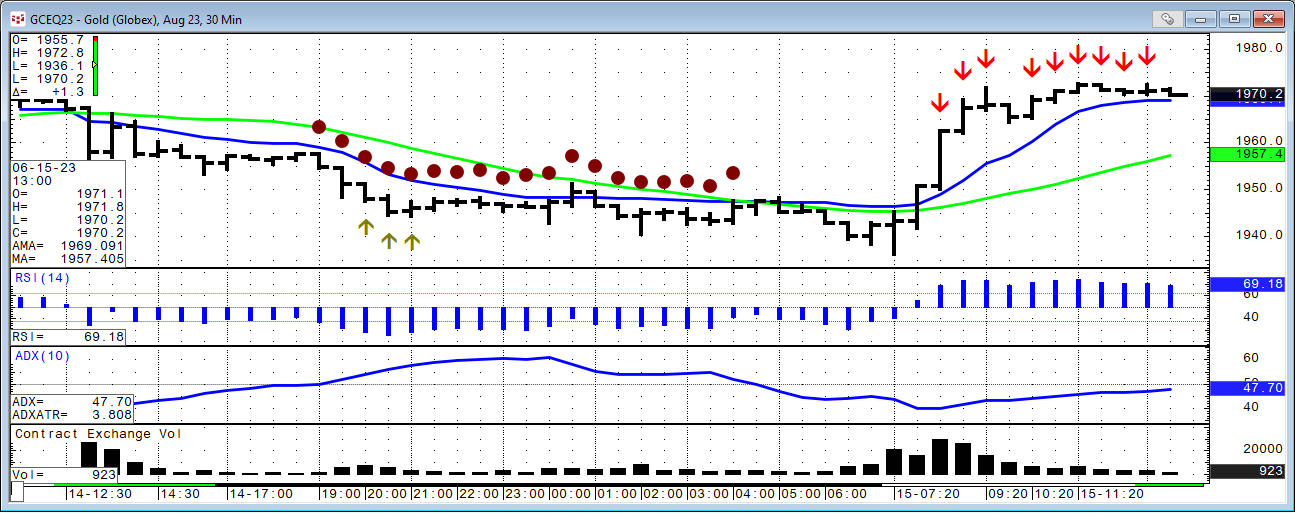
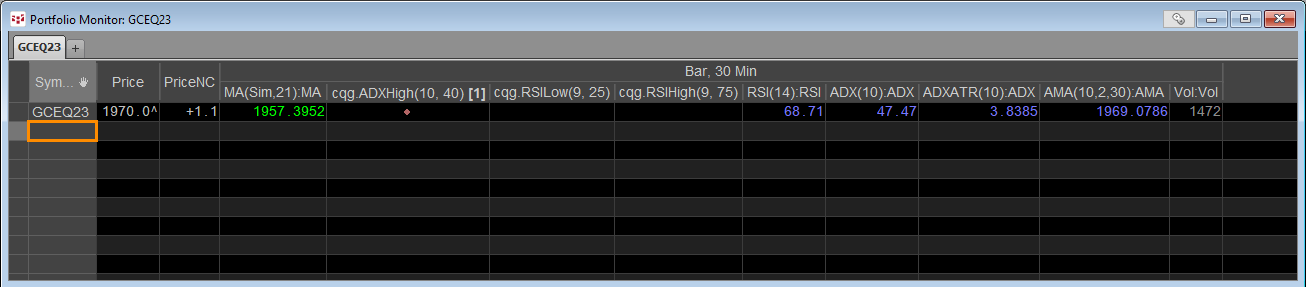
Then left-click the Quotes toolbar button at the top of CQG IC and choose to add a new “Portfolio Monitor” from the menu. The new Portfolio Monitor will open with just the last quote and net change for the symbol on the chart. Then, right-click on the chart background and choose “Convert to Monitor” and a list of choices including the new monitor and select that one. The Portfolio Monitor will now display the studies and conditions from the chart for one symbol.
You can modify and add more columns. Right-click on a column for this menu.

To add columns such as Open, High, and low click “Add Columns…”.

You can add additional chart intervals by selecting a different time interval, as well as a different chart type.

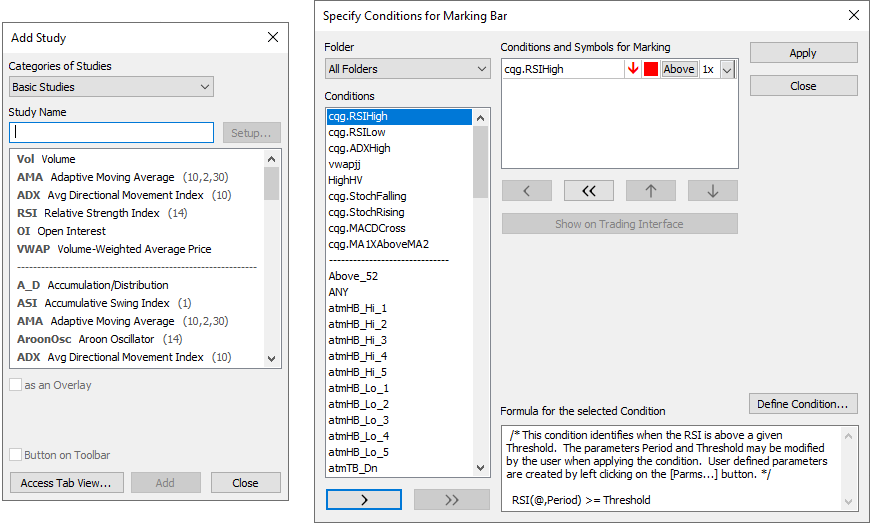
You can add more studies and conditions.
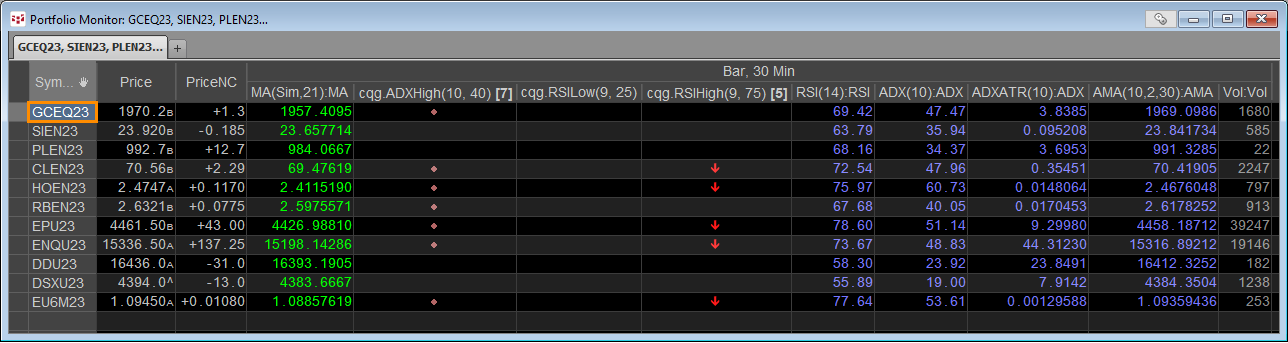
Once you have the Portfolio monitor set up you can copy and paste in symbols from a source such as CQG’s Symbol Finder.
For more details about Portfolio Monitors.
One note: The Portfolio Monitor uses resources within CQG. If you have 100 rows that is the same as opening 100 charts. Performance issues may arise.