In this post, the aspects of becoming a good rule-based trader are discussed. But first, an illustrative story...

While attending college I worked in warehouses on Seattle's waterfront and was a member of the Teamsters Union, local 741. A fellow Teamster was an avid steelhead fisherman. By avid, I mean he would occasionally leave right from work on Friday evening and drive three or four hours to a river and sleep in his van so he could be on the river at daybreak Saturday morning.
Occasionally, during our 30-minute lunch breaks, he would talk about his weekend and how fishing went. It was rare that he did not land a steelhead. One day I recalled a story in the sports section of the newspaper that basically said that there are many steelhead fisherman that may go all season without catching a single fish. I mentioned this story to him and asked what he was doing differently. He responded that he didn't know the other fishermen's' technique and then offered to have me join him for a day of fishing. That sounded fantastic. When I was young, I was in the Boy Scouts, and I loved the once-a-month weekend trip to the Cascades or Olympic Mountains. He invited me to come over Friday night and we would then head out early Saturday morning to one of his favorite rivers.
When I arrived, I expected we would have a beer and watch some sports or a movie. Instead, he was having us set up for the next day's fishing rigs. He explained to me that he used two techniques: One, he used spoons for deep, slow running rivers, usually with large boulders submerged in the river. He said the steelhead likes to rest and recover in the shadows of the boulders. He pointed out that the spoon irritates the steelhead, and they will attack it. Second, for more shallow fast running water he used a rig with a three-way swivel that the bottom swivel connects to a few inches of rubber tubing and the tubing holds a few inches of pencil like lead. The third swivel connects to a leader line with a hook and a small bit of yarn. You cast out into the river and as you slowly reel in the line you can feel clicking in the handle as lead the hits the rocks on the bottom of the river. The steelhead will see the yarn and think it might be food and take the yarn in its mouth and that momentary tension in the line will lift the lead off the rocks and you won't feel the clicking in the rod's handle. You then aggressively set the hook.
We spent time putting together a dozen of each of the two rigs and then attached them to our vests. So, if either one was snagged you could just break the line and immediately attach a new one. With a dry smile, he said: "you can't catch a fish if your line is not in the water."

We arose very early Saturday morning and drove to the river. We parked just off the road and walked on a trail for about a quarter of a mile. Coming upon the river was a classic beautiful scene in the Cascades Mountains. The early morning sun was filtering down to us through the sixty- to seventy-five-foot-tall evergreen trees. The river was deep with large boulders and a dark green color reflection from the trees. The trees on both sides of the river created a canyon-like feel and the blue-sky overhead was striking.
We fished for about twenty minutes using the spoons when he turned and said: "Let's go." I said: "Why, we just got here?" He responded: "There are no fish here, otherwise, we would have had a strike." We then jogged back to his van. We did that all day. Fish for twenty minutes at a spot then quickly move to another one. Basically, he was hunting down the steelhead. And, for what it's worth, by the end of the day he did catch a steelhead, I did not.
What does this story have to do with trading? Everything. First, my friend specialized. He only used two techniques, and he fully understood why the techniques worked, and he never wavered from his method. Next, he prepared. He spent his time before fishing getting ready because: "If you don't have your line in the water, you can't catch a fish." Finally, he executed his plan. As I said before: "He hunted down the steelhead."
The Key for Traders: Specialization, Preparation, and Execution
Specialization is the first step, and it requires a lot of time and energy to research the technical world looking for technical based strategies that will be the starting blocks for a rule-based trading system. And, as the literature is not peer reviewed you will have to check everything out with your own testing. For example, here is an explanation from Investopedia detailing the Relative Strength Index:
"The RSI can do more than point to overbought and oversold securities. It can also indicate securities that may be primed for a trend reversal or corrective pullback in price. It can signal when to buy and sell. Traditionally, an RSI reading of 70 or above indicates an overbought situation. A reading of 30 or below indicates an oversold condition."
Now, the above explanation may be fine if a market is in a trading range, but if the market is trending then those guidelines are of no value. For example, the daily chart below of the E-mini NASDAQ 100 (symbol: ENQ) with a 14-bar RSI shows the market is making rising swing highs and rising swing lows.
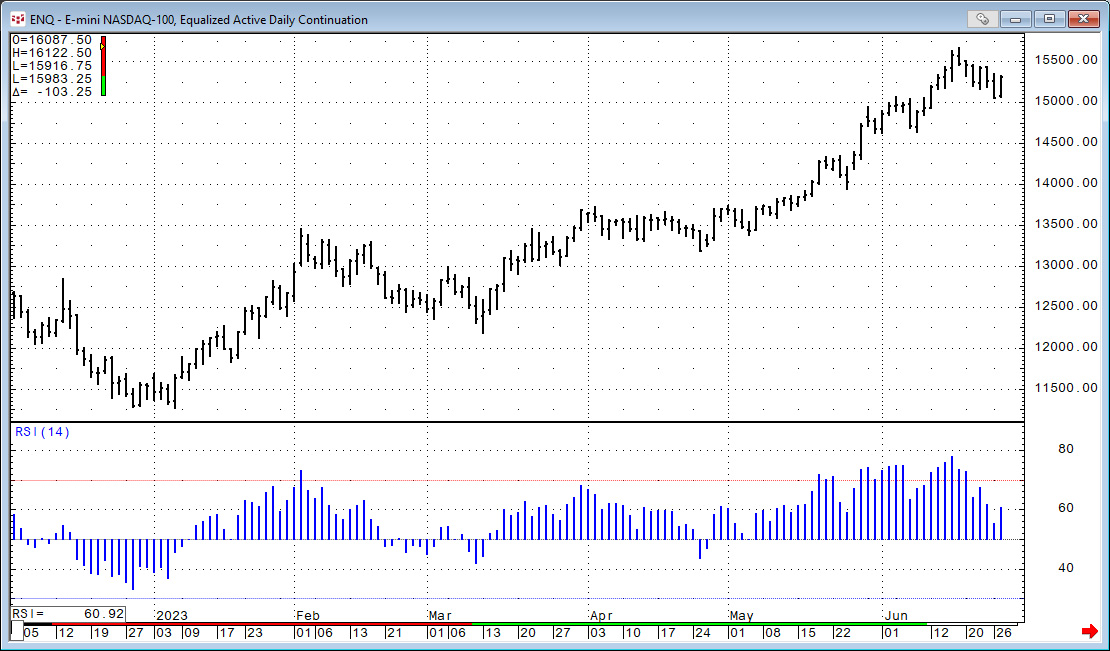
Checking the RSI above and you see that the values exceeded 70 or came near 70 coincident with price peaks while during the declines the RSI dropped to only below 40, or the values turned back up from just above 40.
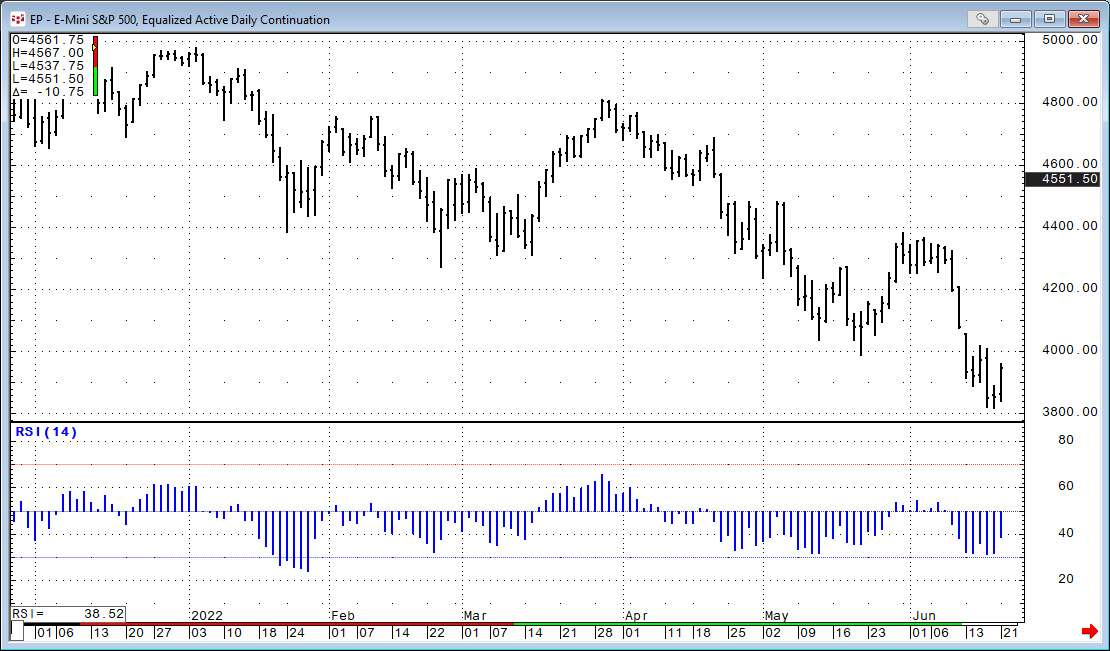
Viewing the chart above of the E-Mini S&P 500 the price action is a downtrend, and the RSI never reaches 70 and only reaches 30 January.
What these two charts illustrate is if the market is in an uptrend, then the range of the oscillator values shifts upwards. On the other hand, if the market trend is downward then the range of the oscillator values moves downward. This observation is not detailed in the typical explanations of this study. Therefore, when exploring studies to use for your rules you must verify whether the published literature is actually true.
Next, there is a psychological component to trading based on rules. That is your personal tolerance for risk and desire for reward. Obviously, everyone's goal is to make a lot of money. But can you tolerate the risk due to the inherent volatility in a market. Can you cope with the level of unrealized and realized losses that are a part of trading.
Case in point is illustrated by a book published by trader and author Larry Williams. I believe it was in his How I Made One Million Dollars ... Last Year ... Trading Commodities - February 10, 1998.
The inside cover of the book was a copy of his January monthly statement showing the deposit of $10,000. The back inside cover was his December monthly statement showing a closing balance of over $1,000,000. However, if you looked over the December monthly statement you would see some very large realized losses. As I recall, a couple were around six figures. Be honest with yourself; Can you tolerate equity swings of that magnitude? This is a critical component.
Preparation is the real work. Look to the Scientific Method for the guideline steps:
- Define a Question to Investigate
- Develop a hypothesis
- Gather Data to test the hypothesis
- Analyze the Data
- Draw Conclusions
As an example, the first point the question could be does a particular oscillator study generate profitable trades. Next, the hypothesis is that from simple observations market tops can coincide with the stochastics oscillator peaking and turning down and market bottoms concur with the stochastics oscillator and turning up from a low. Next, set precise rules including study parameters for the top and bottom signals as a basis to buy and sell and then back-test the system. You can then analyze the results of the test and draw a conclusion. You cannot just do one test. When you set up the fixed rules the results may be good on what is referred to as in-sample data. Take the same rules and test it over a different time period, which is referred to as out-of-sample and see if the results hold up. This is very important if the study parameters were optimized. Market volatility can and will change.
CQG offers a sophisticated Back Testing module, which enables you two test your hypothesis. This link is to the Advanced Analytics Help file. The chart is displaying CQG's SuperTemplate system. In addition, CQG's Product Specialist Helmut Mueller has authored a number of helpful posts on his Coding blog.
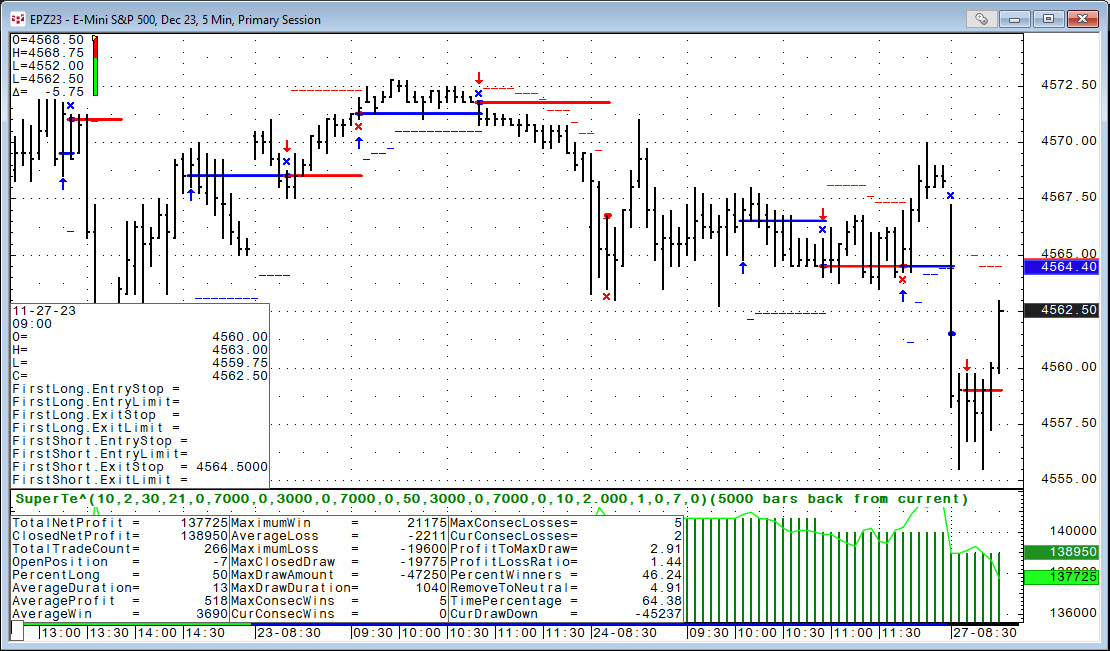
A large amount of information is gleaned from statistics table. This link details each output from the tested trading system.
However, the statistics' details are based on the entry and exit prices and are the closed-out trades. You do not learn the performance of each trade while actually in the trade. What was the largest open profit and what was the largest open loss for each trade? This information could be helpful.
John Sweeney, former Editor of Technical Analysis of Stocks & Commodities magazine wrote two books:
- Campaign Trading: Tactics and Strategies to Exploit the Markets (Wiley Finance) 1st Edition Publisher (July 26, 1996)
- Maximum Adverse Excursion: Analyzing Price Fluctuations for Trading Management (Wiley Finance) 1st Edition Publisher (January 6, 1997)
In these two books Sweeney details his ideas of tracking Maximum Favorable Excursion (MFE) and Maximum Adverse Excursion (MAE) as key information for analyzing a trade system. MFE is the largest open profit and MAE is the largest open loss while in the trade. The next image displays the concept.
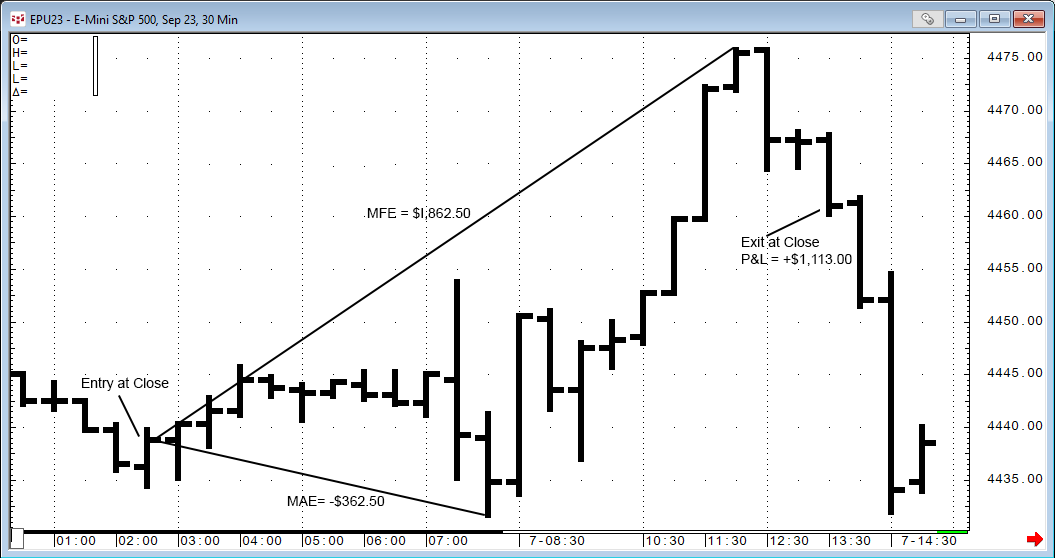
Reviewing the trade data with MFE and MAE analysis will often break trades down into one of three groups. The best is the trade has a small MAE and Exits near the peak of the MFE. Below is MFE and MAE analysis of a single trade.

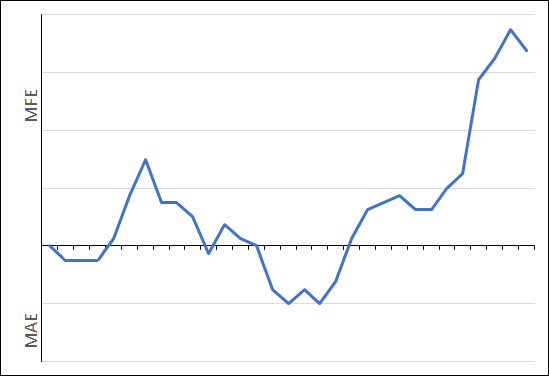
Next is an example of a trade that moved up and down, dipped into the MAE area but recovered and closed with a profit.
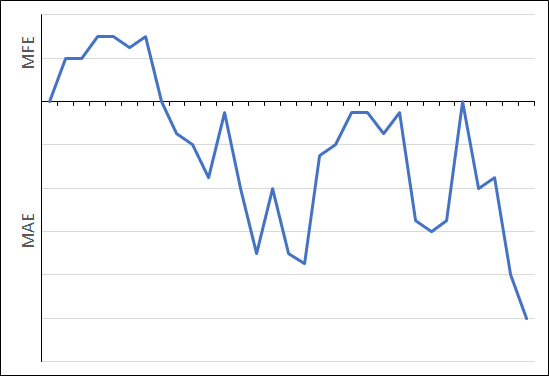
Finally, there will be trades that were bad from nearly the start and were closed out with a loss.
Once the data is analyzed then sort the individual MAEs from smallest to largest along with the closed-out P&L for each trade.
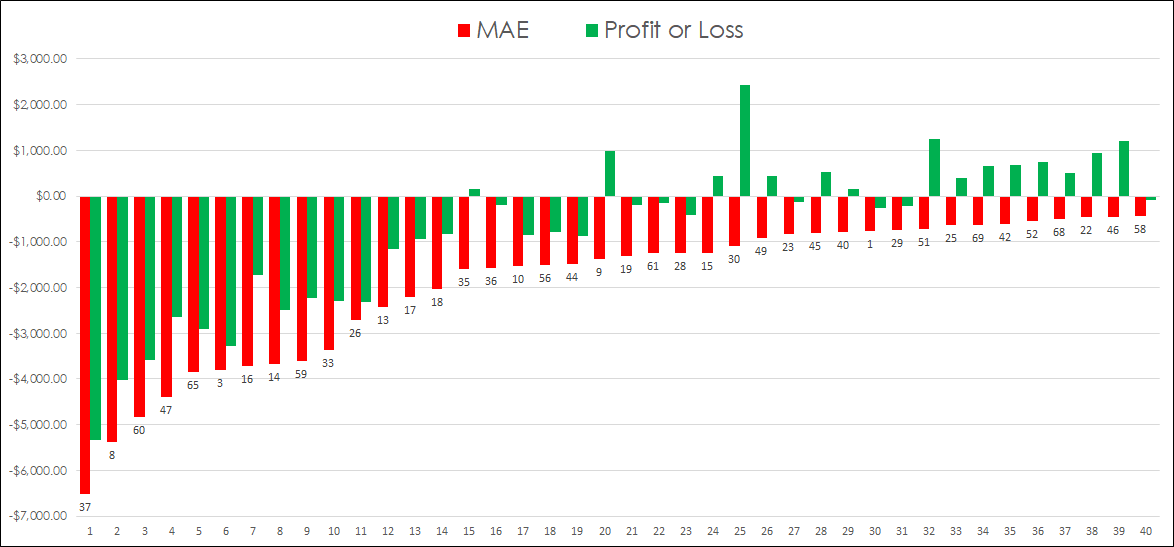
Looking at the image above it appears that a hard money stop of $1,000.00 costs a few profitable trades but eliminates many of the worst losses.
Next, sort the MFEs by smallest to largest along with the closed-out P&L. The MFE analysis can lead to determining a target for partial profits of the trades.
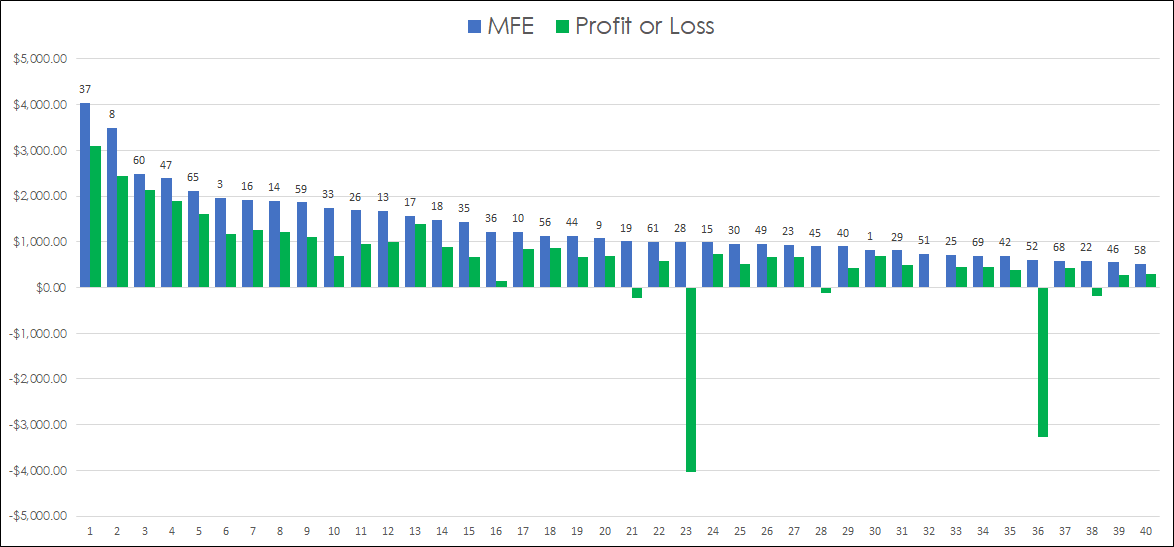
If you would like to see MFE and MAE trade analysis in CQG the visit the CQG Forums and request the feature.
With a developed set of trading rules that can be written down, including entry and exit points, you are ready to execute your trading plan.
For many, execution is really a psychological issue because of the uncertainty that exists when actually trading, not just reviewing computer analysis. For that reason, the best recommendation is to read Trading in the Zone: Master the Market with Confidence, Discipline, and a Winning Attitude - April 1, 2000
To this day, Mark Douglas's books are very popular. Here is an overview of Mark's book by Nial Fuller.
This post was intended to focus on the topic of trading based on three key ideas:
- Specialization
- Preparation
- Execution