This Microsoft Excel® dashboard displays all of the ICE-traded Three-Month SONIA contracts including volume and open interest data.
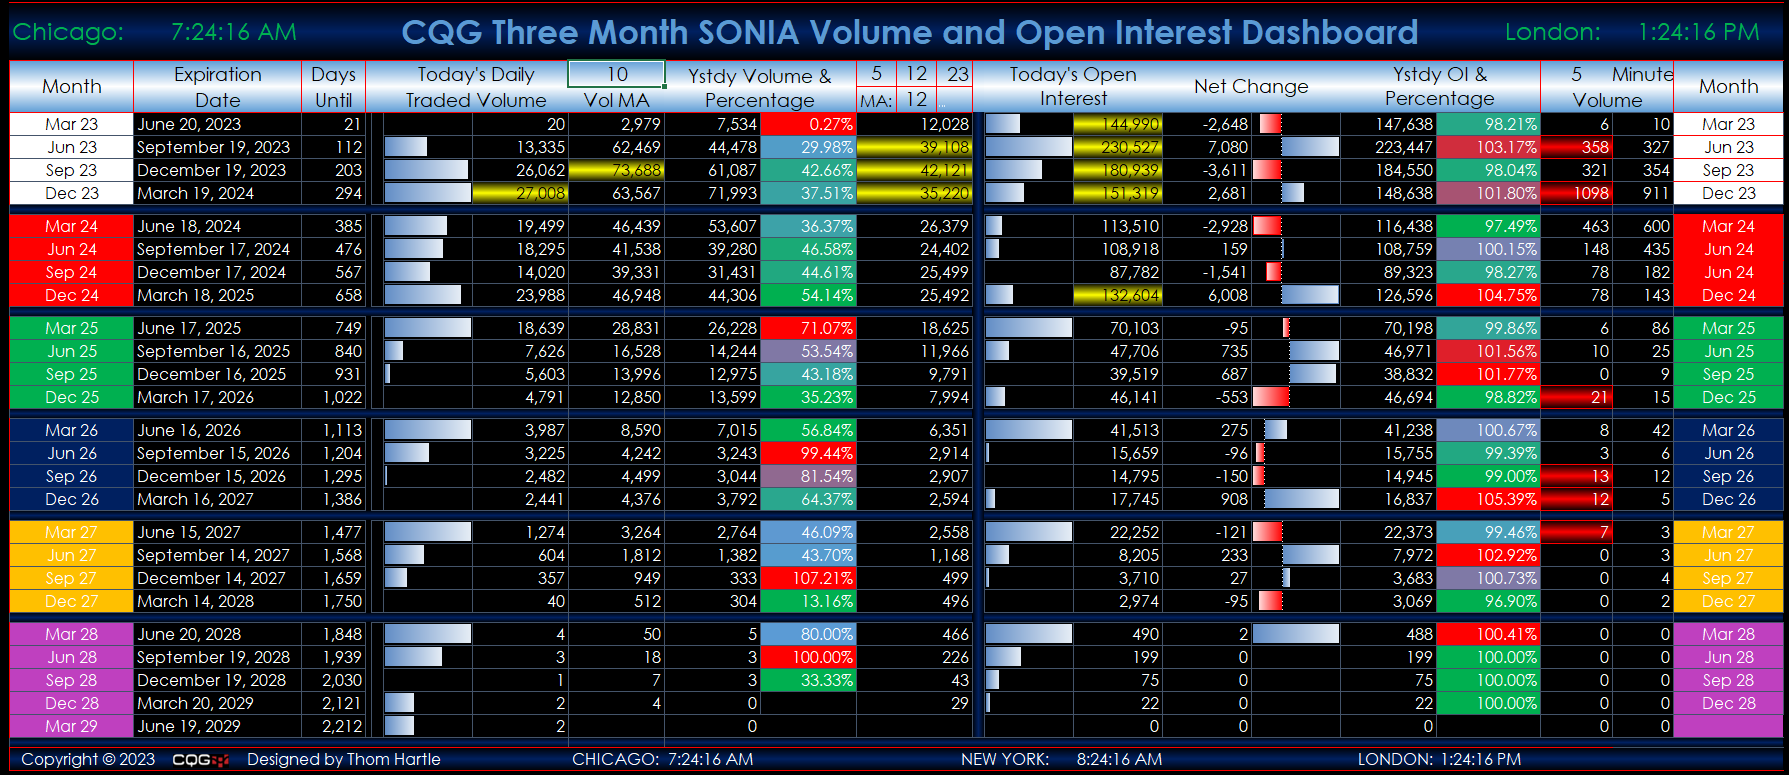
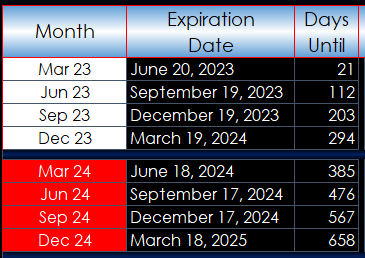
The first three columns detail the contract month and year, the expiration date and the number of days until the expiration.
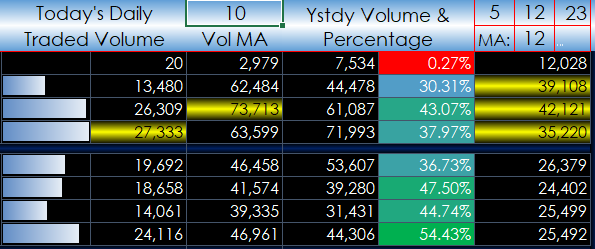
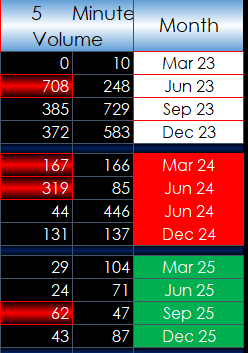
Next, is current volume details. Today’s traded volume with condition based data bars to the left showing relative values. The top volume traded is highlighted in yellow. The next column is a user select moving average of the volume. If today’s volume is greater than the moving average today’s volume is highlighted in red. Next is yesterday’s volume and next is the current percentage ratio of today’s volume to yesterday’s volume. The last column is a user selected moving average of the volume with the top three highlighted in yellow.
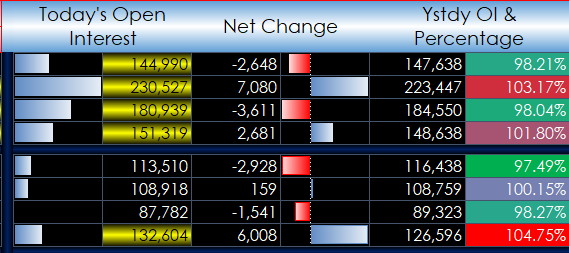
The next group is open interest data. Today’s open interest is displayed with the largest five contracts highlighted in yellow. The net change is displayed. Yesterday’s open interest and the percentage ratio of today’s open interest to yesterday’s open interest is displayed.
The last group allows a user input for bar time frame and the current bar’s volume is displayed. If today’s current bar’s volume is larger than the same bar in the previous session the bar is highlighted in red.
Requirements: CQG Integrated Client or QTrader, data enablements for all symbols displayed in this spreadsheet, and Excel 2010 or more recent.