This study calculates the Market Profile’s value area and point of control (POC). First, a brief overview of the Market Profile chart then the Excel RTD formulas for MPVAPOC, MPVAHigh and the MPVALow are detailed.
To start, Market Profile distributions are constructed of TPOs (Time Price Opportunities). Each TPO letter identifies a time when the market traded at the price indicated on the vertical axis. CQG line time (United States Central Time) is used.
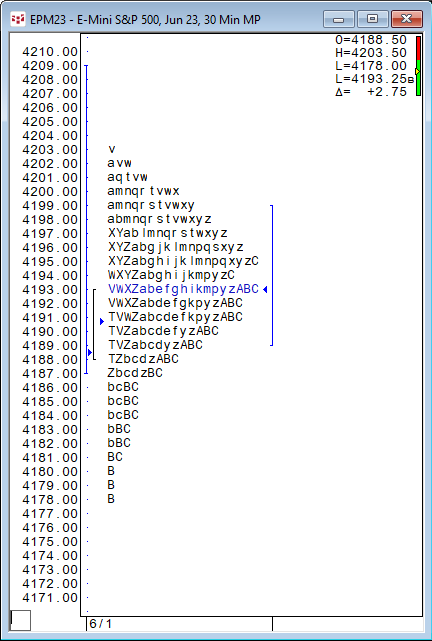
The Market Profile Value Areas (MPVA) study calculates the Market Profile’s value area and point of control (POC). Above, the value area is the vertical line on the right-hand side of the distribution and the POC is the blue arrow next to the line at the price of 4193.
The value area begins calculating at the POC. The system expands the value area one price at a time in either direction until the value area represents 70% of the TPOs, choosing the direction on each iteration on the basis of the number of TPOs the two prices adjacent to the current value area have. It is expanded in the direction of the price having more TPOs.
On a bar chart with the MPAVA study applied the high boundary of the value area is represented by a green line, and the low boundary of the value area is represented by a red line. You can see in the chart below the green, blue and red line match the high and low values of the blue vertical line to the right in the MP distribution chart above.
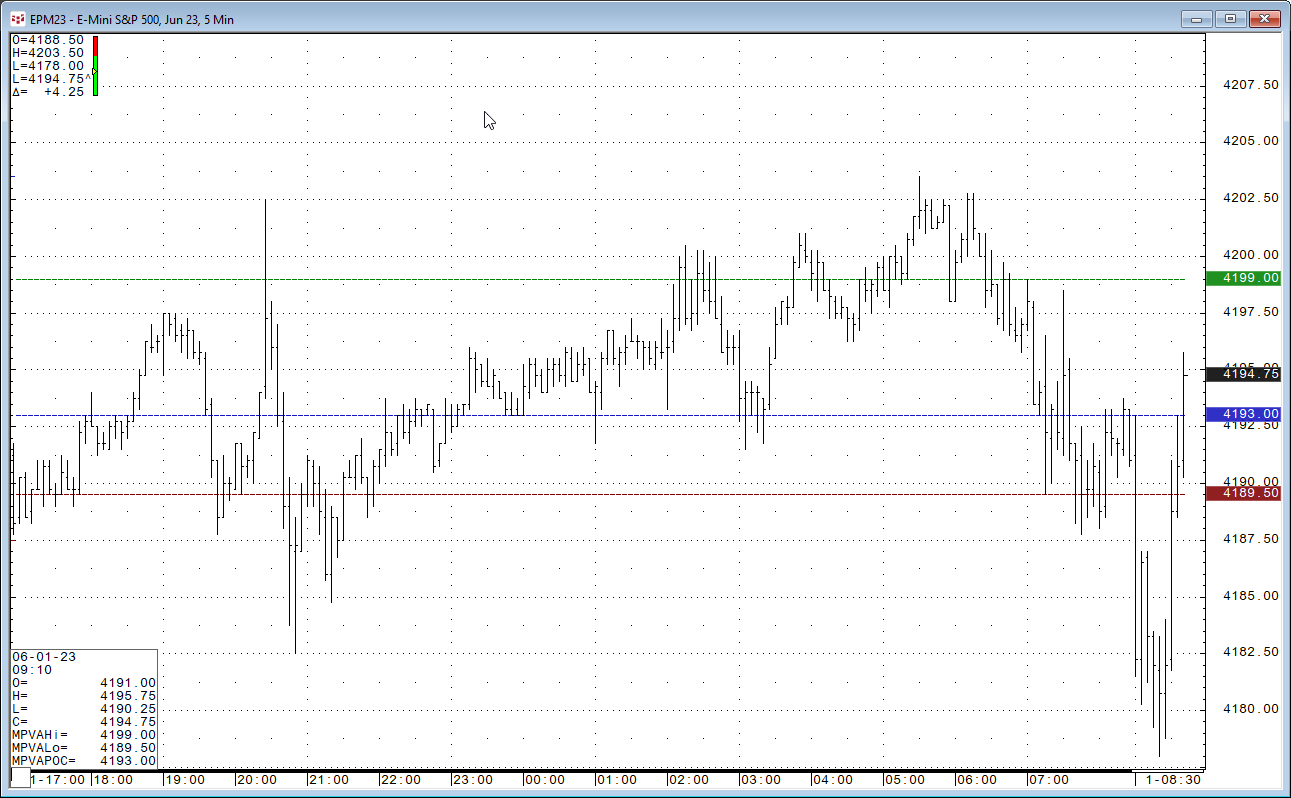
There are three Excel RTD formulas to pull in the study values displayed on the scale of the chart and in the cursor value box at the bottom left corner of the chart. If you want to use the default settings then the RTD formulas are:
MPVAHi
= RTD("cqg.rtd",,"StudyData", "EP", "MPVA", "MPInterval=30", "MPVAHi","D",,"ALL",,,"TRUE","T")MPVAPOC
= RTD("cqg.rtd",,"StudyData", "EP", "MPVA", "MPInterval=30", "MPVAPOC","D",,"ALL",,,"TRUE","T")MPVALo
= RTD("cqg.rtd",,"StudyData", "EP", "MPVA", "MPInterval=30", "MPVALo","D",,"ALL",,,"TRUE","T")There are more parameters available for customizing the three studies.
MPVAHi
= RTD("cqg.rtd",,"StudyData", "EP", "MPVA", "MPInterval=30,StartTime=0,BeginCondition=none,Lookback=100,BarsBack=100,DaysBack=1,Dynamic=0,DynamicInterval=30,CalculateOn=0,Type=2,VACoverage=68,PocDistance=1,TPOPlacement=0,VolPlacement=0", "MPVAHi","30",,"ALL",,,"TRUE","T")MPVAPOC
= RTD("cqg.rtd",,"StudyData", "EP", "MPVA", "MPInterval=30,StartTime=0,BeginCondition=none,Lookback=100,BarsBack=100,DaysBack=1,Dynamic=0,DynamicInterval=30,CalculateOn=0,Type=2,VACoverage=68,PocDistance=1,TPOPlacement=0,VolPlacement=0", "MPVAPOC","30",,"ALL",,,"TRUE","T")MPVALo
= RTD("cqg.rtd",,"StudyData", "EP", "MPVA", "MPInterval=30,StartTime=0,BeginCondition=none,Lookback=100,BarsBack=100,DaysBack=1,Dynamic=0,DynamicInterval=30,CalculateOn=0,Type=2,VACoverage=68,PocDistance=1,TPOPlacement=0,VolPlacement=0", "MPVALo","30",,"ALL",,,"TRUE","T")For more details please check the MPVA Study Help file. A sample spreadsheet is available for viewing daily historical values.
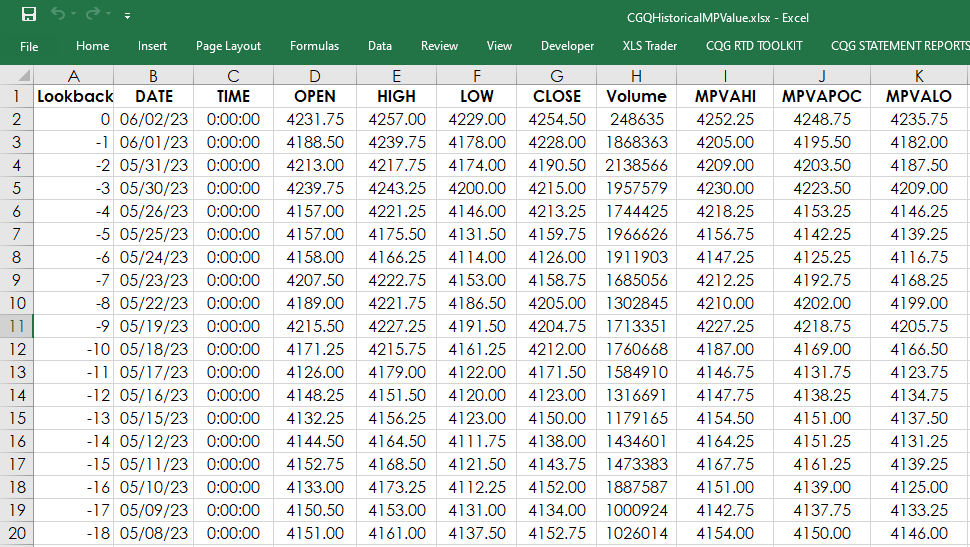
Requirements: CQG Integrated Client and the Market Profile enablement (not available for QTrader), data enablements for symbols displayed in this spreadsheet, and Excel 2010 or more recent.