This macro-enabled Excel dashboard pulls in futures call and put options data for a specific underlying contract. There are two tabs: Call Data and Put Data.
Each tab has the following columns:
- Symbol: The options symbols with strikes
- Last: Last traded Price
- NC: Net change of the last trade
- Bid Vol: Best bid volume
- Bid: Best bid
- Ask: Best ask
- Ask Vol: Best ask volume
- Volume: Current traded contract volume
- Yesterday Vol: Previous session’s contract volume
- Volume Change: The current difference
- Open Int: Current open interest
- Prev OI: Previous open interest
- OI Change: The current open interest change
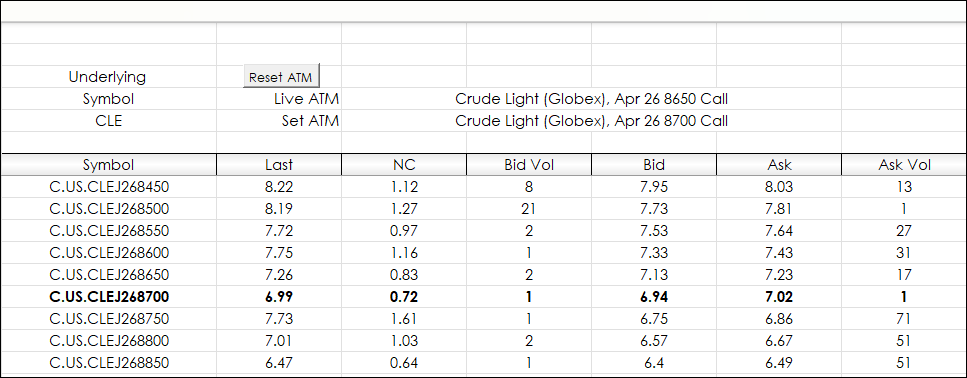
When the dashboard is first opened enter the Underlying Symbol in Cell B6 on the Call Tab. Do not change the Put Data Tab.
Use all capital letters, such as CLE. For the next series use a wild card, such as CLE?2.
Volatile markets may change the At-The-Money (ATM) strike every few minutes (often flipping back and forth). A dashboard that automatically updates using the current ATM will be constantly changing.
This dashboard displays the live or current ATM. To set the dashboard to use the current ATM click the Reset ATM button and the “Set ATM” will update. The line of data for the current ATM is highlighted in bold.
This feature is managed on the Call data tab. The Put data tab will automatically update. The data display can roll up and down and the column labels are fixed.
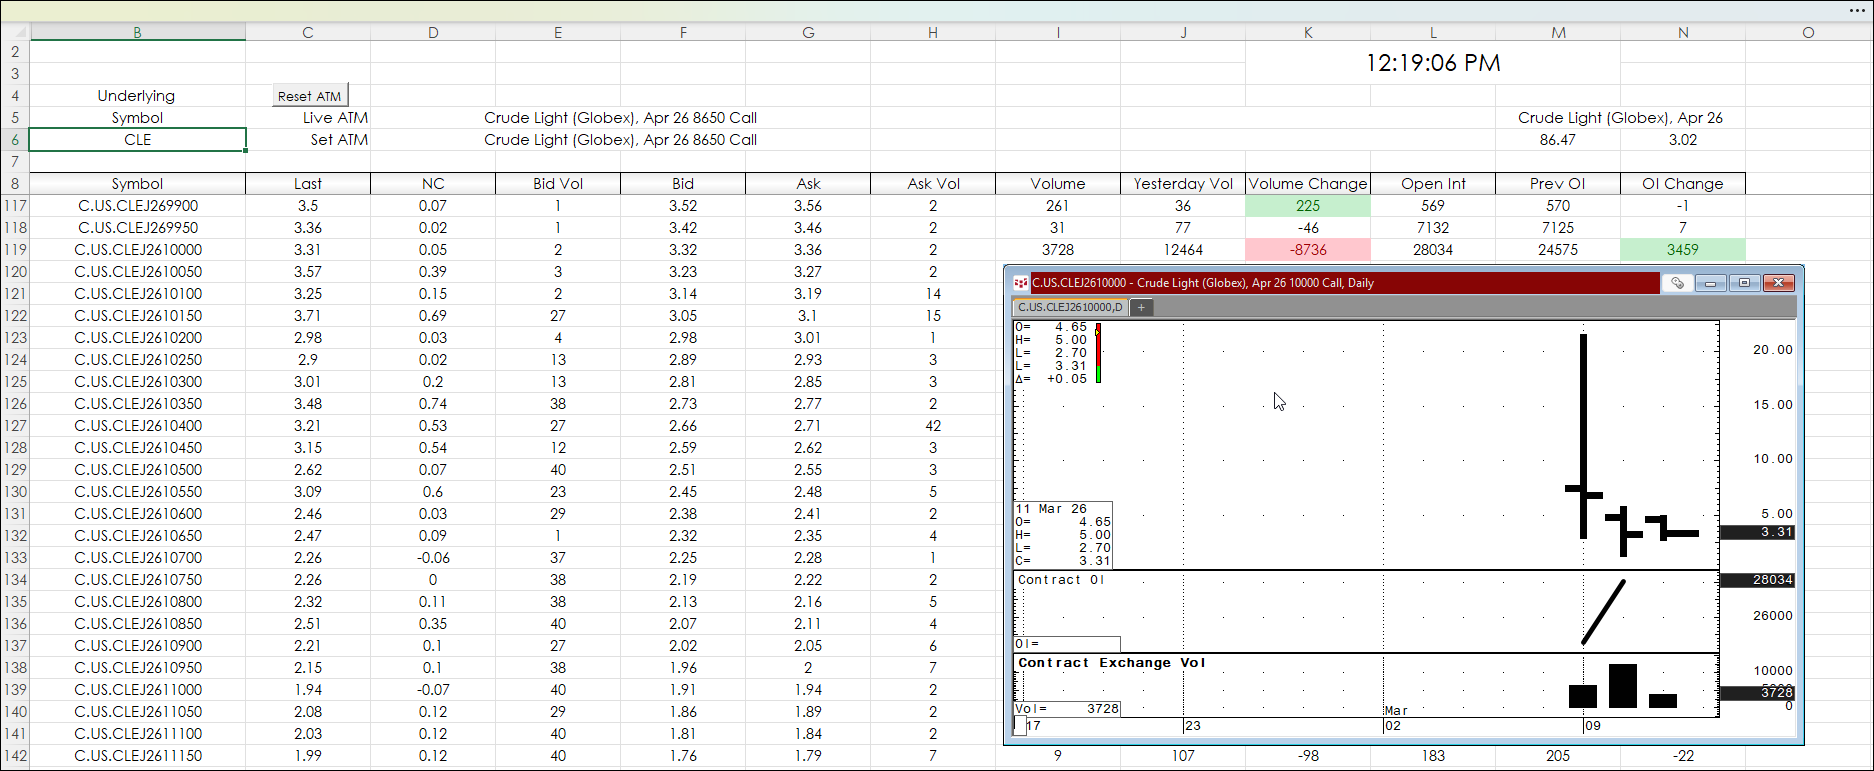
CQG provides the current open interest data, which is published by the exchange for yesterday's session. The previous open interest is for the session before yesterday. The volume is for the current session, and the previous volume is for the previous session. This is the extent of the historical volume and open interest data available.
The image below shows the open interest and the volume chart overlayed on the Excel dashboard for the option symbol: C.US.CLEJ2610000.
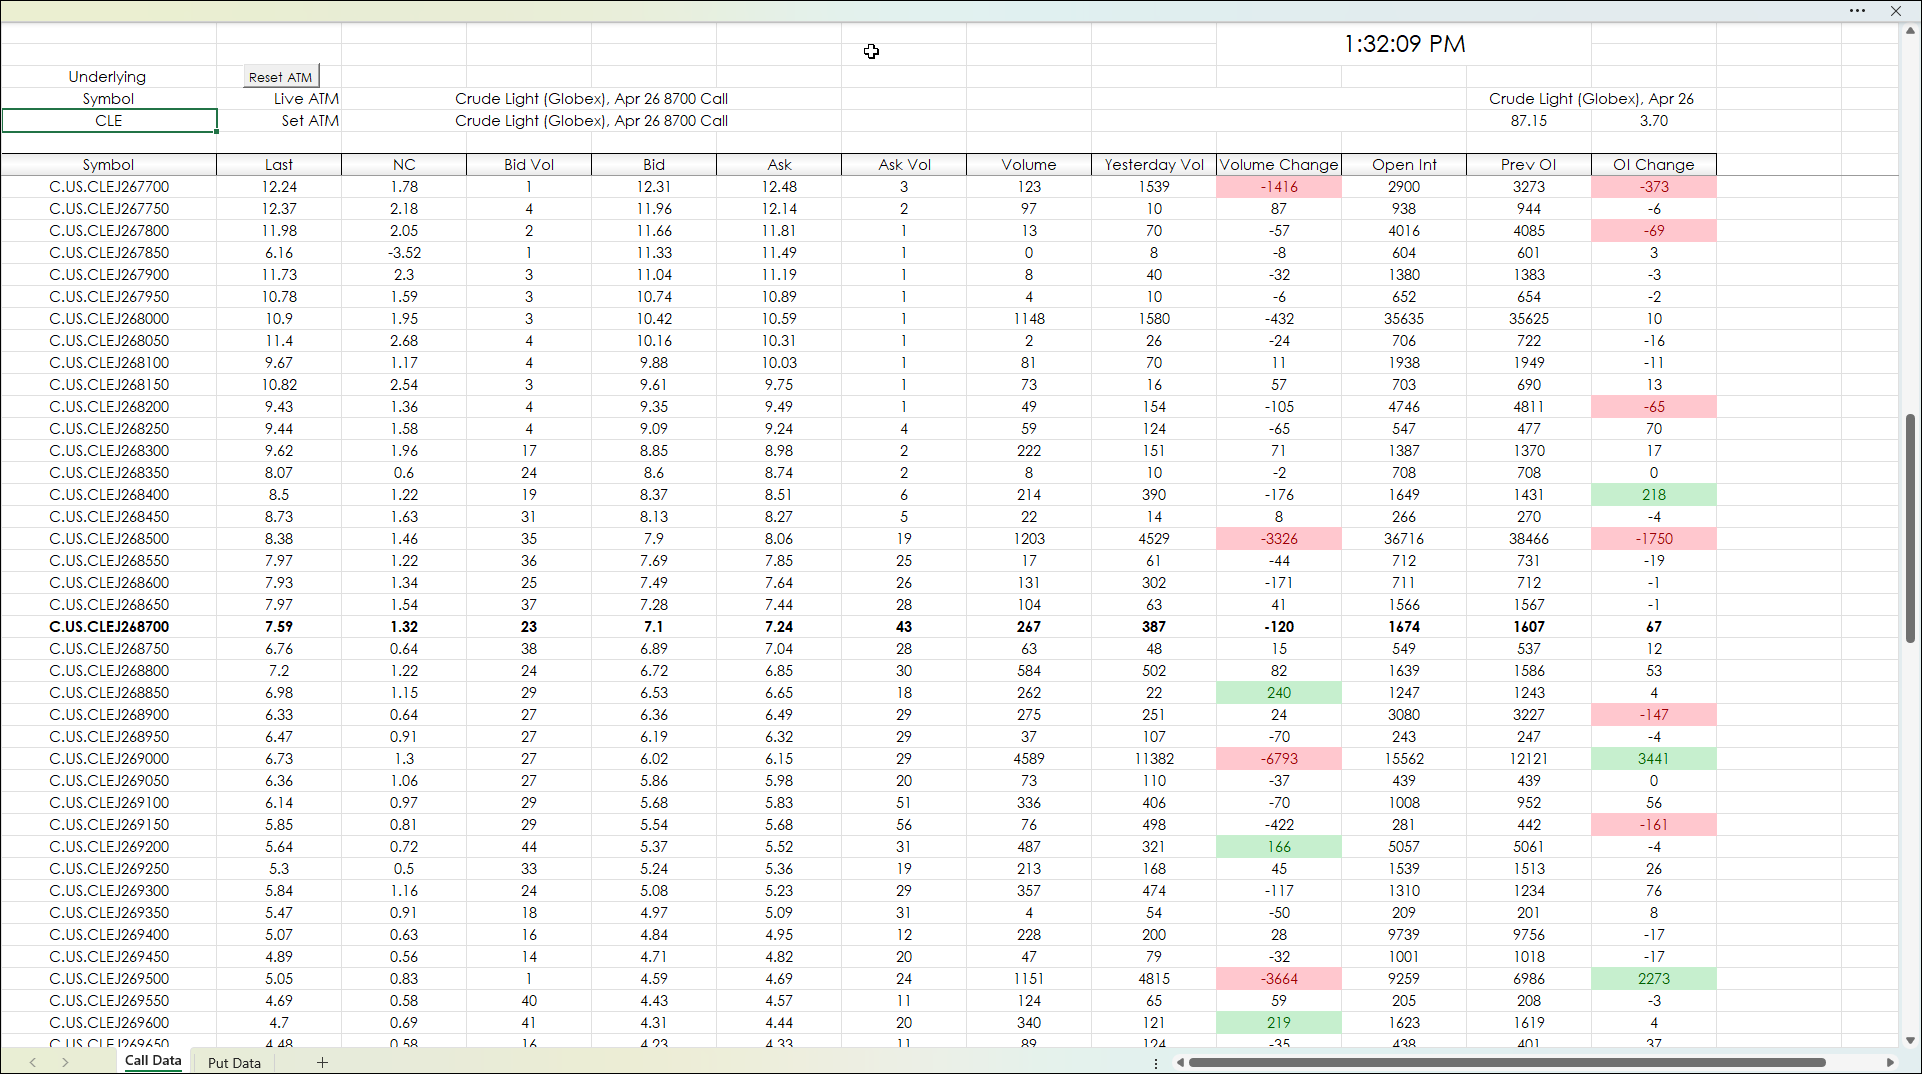
The Volume Change and the Open Interest Change columns are each color formatted to display the top ten (green) and the Bottom 10 (red) cells.
The next image is a full view of the dashboard.
When changing symbols, it can take a minute or two for the dashboard to fully update.
Make sure to lower your Excel Realtime Data (RTD) throttle to 0 milliseconds or lower. Learn how to do that here.
Requires CQG Integrated Client or CQG QTrader, and Excel 365 or more recent locally installed, not in the cloud.