This post offers two Excel dashboards for tracking the holdings of the iShares U.S. Aerospace & Defense ETF (Symbol: ITA).
The iShares U.S. Aerospace & Defense ETF seeks to track the investment results of an index composed of U.S. equities in the aerospace and defense sector.
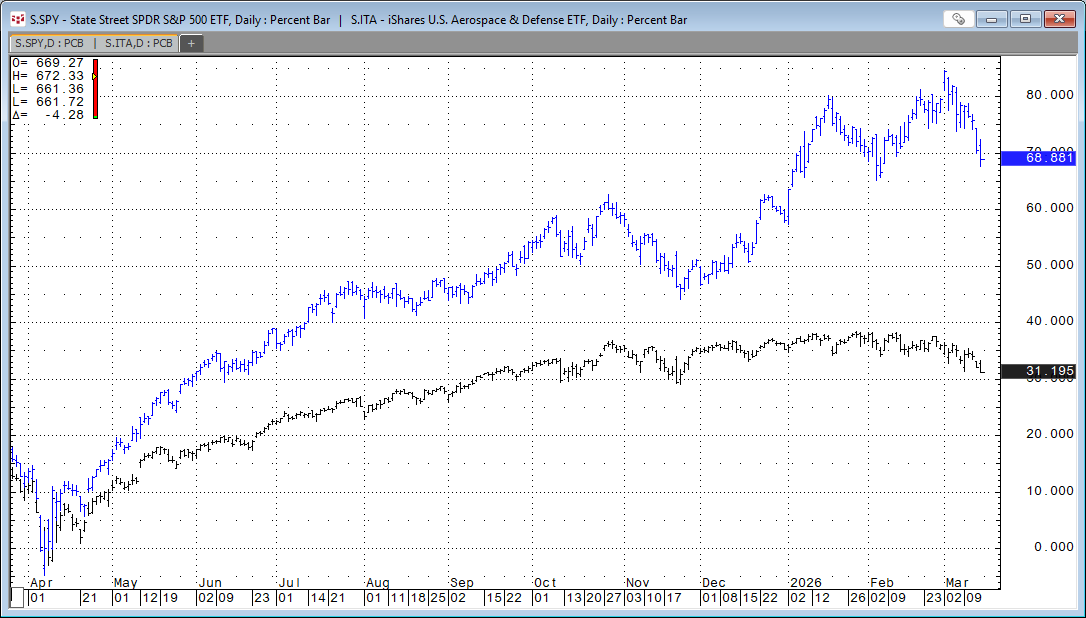
The image above compares the price performance of the ITA ETF to the SPY ETF since the April lows of 2025. This table details the top ten holdings.
| Symbol | Company | % Assets |
|---|---|---|
| GE | GE Aerospace | 20.99% |
| RTX | RTX Corporation | 15.79% |
| BA | The Boeing Company | 7.55% |
| LMT | Lockheed Martin Corporation | 5.26% |
| HWM | Howmet Aerospace Inc. | 5.13% |
| NOC | Northrop Grumman Corporation | 4.90% |
| LHX | L3Harris Technologies, Inc. | 4.79% |
| GD | General Dynamics Corporation | 3.92% |
| TDG | TransDigm Group Incorporated | 3.76% |
| AXON | Axon Enterprise, Inc. | 3.48% |
This table details the top ten performers through 3/13/2026.
| Symbol | Company | Performance |
|---|---|---|
| S.US.RCAT | Red Cat Holdings Cmn | 100.00% |
| S.US.SWBI | Smith & Wesson Brand | 39.82% |
| S.US.KRMN | Karman Holdings Inc. | 36.64% |
| S.US.LMT | Lockheed Martin Corp | 33.56% |
| S.US.DRS | Leonardo Drs, Inc Cm | 32.88% |
| S.US.DCO | Ducommun Inc | 31.56% |
| S.US.NOC | Northrop Grumman Corporation | 28.67% |
| S.US.MOGA | Moog Inc Clsa | 23.83% |
| S.US.ATI | Ati Inc. | 23.71% |
| S.US.NPK | National Presto Industries Inc. | 23.25% |
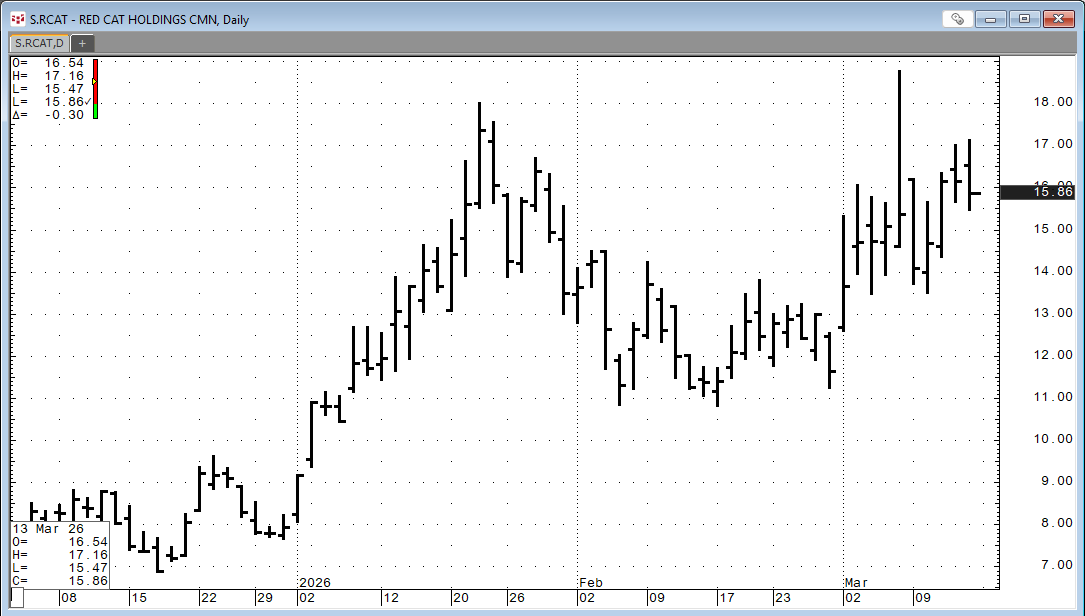
The top performer through 3/13/2026 is Red Cat Holdings. From Yahoo.Finance: "Red Cat Holdings, Inc., together with its subsidiaries, provides products, services, and solutions to the drone industry in the United States. It integrates robotic hardware and software solutions for military, government, and commercial operations; and offers short range reconnaissance, med range reconnaissance, unmanned surface vessels, and controllers." Here is the daily bar chart for RCAT.
| Symbol | Company | Performance |
|---|---|---|
| S.US.BA | Boeing Company | -3.33% |
| S.US.LOAR | Loar Holdings Inc. | -4.90% |
| S.US.TDG | Transdigm Group | -8.66% |
| S.US.SARO | Standardaero, Inc. | -9.14% |
| S.US.HEI | Heico Corp | -10.86% |
| S.US.HEIA | Heico Corp Cla | -12.30% |
| S.US.AXON | Axon Enterprise, Inc | -12.63% |
| S.US.AVAV | Aerovironment, Inc. | -14.39% |
| S.US.ACHR | Archer Aviation Inc | -19.81% |
| S.US.CDRE | Cadre Holdings, Inc. | -22.50% |
Below is an image of the downloadable Excel Dashboard. During the trading session, the Excel dashboard dynamically ranks the individual stocks held by ITF.
The Excel dashboard displays the top fifteen positive and bottom fifteen negative performers as histogram bar charts, along with their respective net percent change for today's trading session.
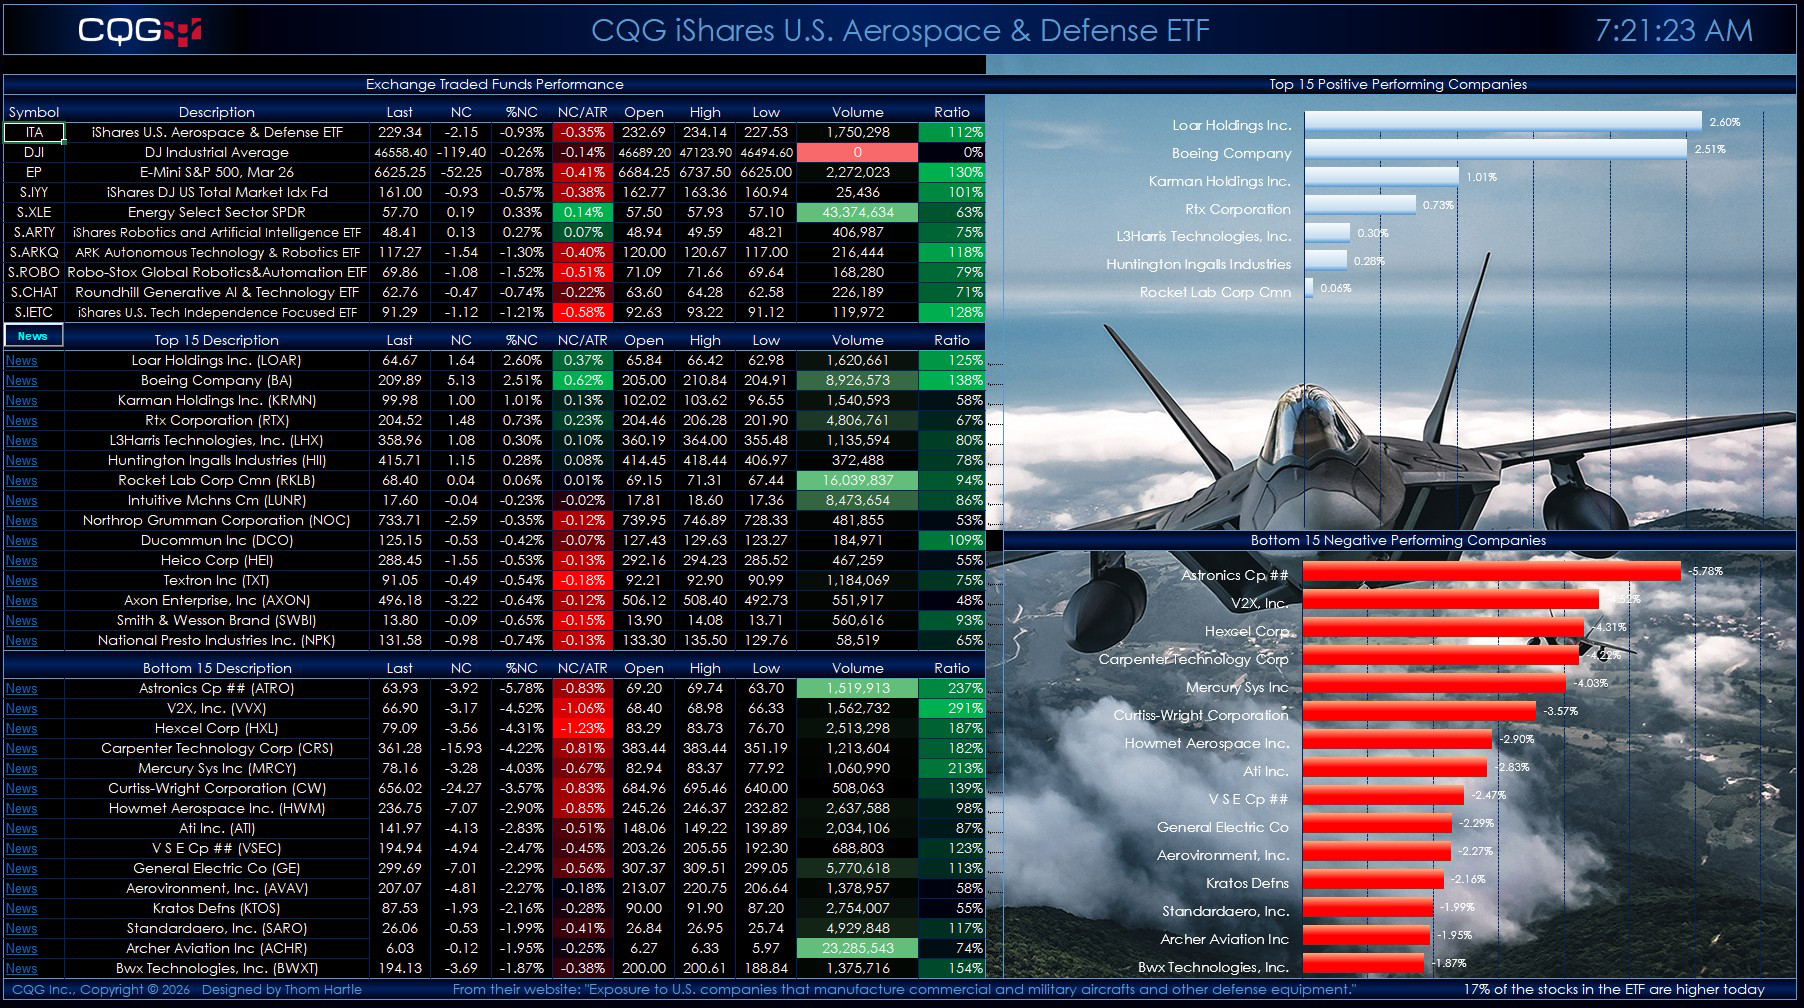
To the left, the top section of the quote display allows you to enter your own symbols.
The second section displays the top fifteen performers. The third section displays the bottom fifteen performers.
Quote data includes today's net change as a ratio to the 21-day Average True Range study. Next to today's traded volume is a column that calculates the ratio of today's volume versus the 21-day average of the volume. This ratio column gives you a sense of how active today's trading is. Readings of 100% and higher indicate active trading.
A key feature next to each company name is a link to Yahoo Finance. Clicking the News link will take you to the Yahoo page for that symbol. Note that this could take approximately 30 seconds to open in a browser. Turning off Extensions in your browser will make this happen faster.
If you open another Excel spreadsheet, then this dashboard will no longer be the active spreadsheet. The macro that updates the links and ranks the stocks by performance will stop. To start the macro, simply click the News toolbar button in the first column.
The current holdings are as of 3/13/2026. There is a Symbols tab with instructions detailing where to download the latest posted spreadsheet with the current holdings and steps to update the dashboard.
Two dashboards are available: One has a solid black background, and one has an image background.
Requires CQG Integrated Client or CQG QTrader, data enablements for the NYSE and Nasdaq stocks, and Excel 365 or more recent locally installed, not in the Cloud.