The ARK Space & Defense Innovation ETF (Symbol: ARKX) goal is an actively managed ETF seeking long-term growth of capital by investing in domestic and foreign equity securities of companies that are engaged in the Fund's investment theme of Space Exploration and defense innovation.
From their website: Companies within ARKX are focused on innovation across "space" or "defense innovation," the advisor defines as leading, enabling, or benefiting from technologically enabled products and/or services that occur beyond the surface of the Earth, including:
- Autonomous Mobility
- Intelligent Devices
- Advanced Battery Technologies
- 3D Printing
- Reusable Rockets
- Adaptive Robotics
- Neural Networks
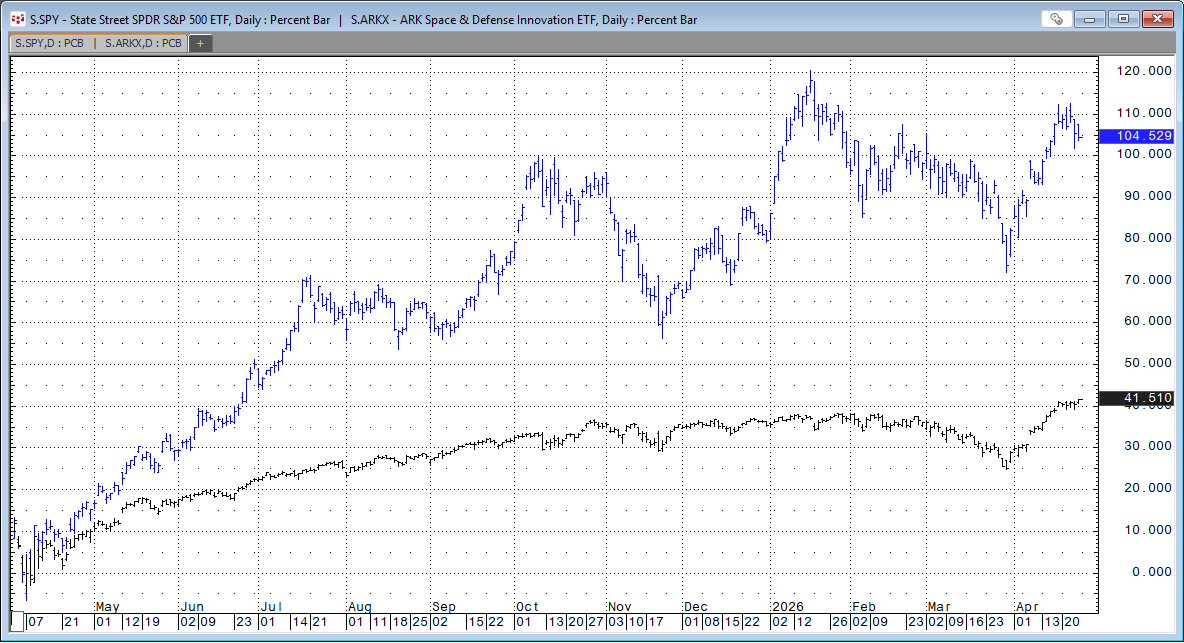
The chart below is the percentage net change from 12/31/2025 for the SPY ETF (black) and the ARKX ETF (blue).
Here is a list of the current top ten holdings as of 6/18/2026.
| Ticker | Company Name | % Holdings |
|---|---|---|
| SPCX | SPACE EXPLORATION TECHN-CL A | 9.44% |
| LHX | L3HARRIS TECHNOLOGIES INC | 6.92% |
| RKLB UQ | ROCKET LAB | 6.76% |
| KTOS | KRATOS DEFENSE & SECURITY | 6.05% |
| DE | DEERE & CO | 5.57% |
| AMD | ADVANCED MICRO DEVICES | 5.19% |
| AVAV | AEROVIRONMENT INC | 4.29% |
| TER | TERADYNE INC | 3.99% |
| GOOG | ALPHABET INC-CL C | 3.92% |
| AMZN | AMAZON.COM INC | 3.79% |
Below is an image of the downloadable Excel Dashboard. During the trading session, the Excel dashboard dynamically ranks the individual stocks held by ARKX. The Excel dashboard displayed below shows the top and bottom fifteen performers as histogram bar charts, along with their respective net percent change for today's trading session.
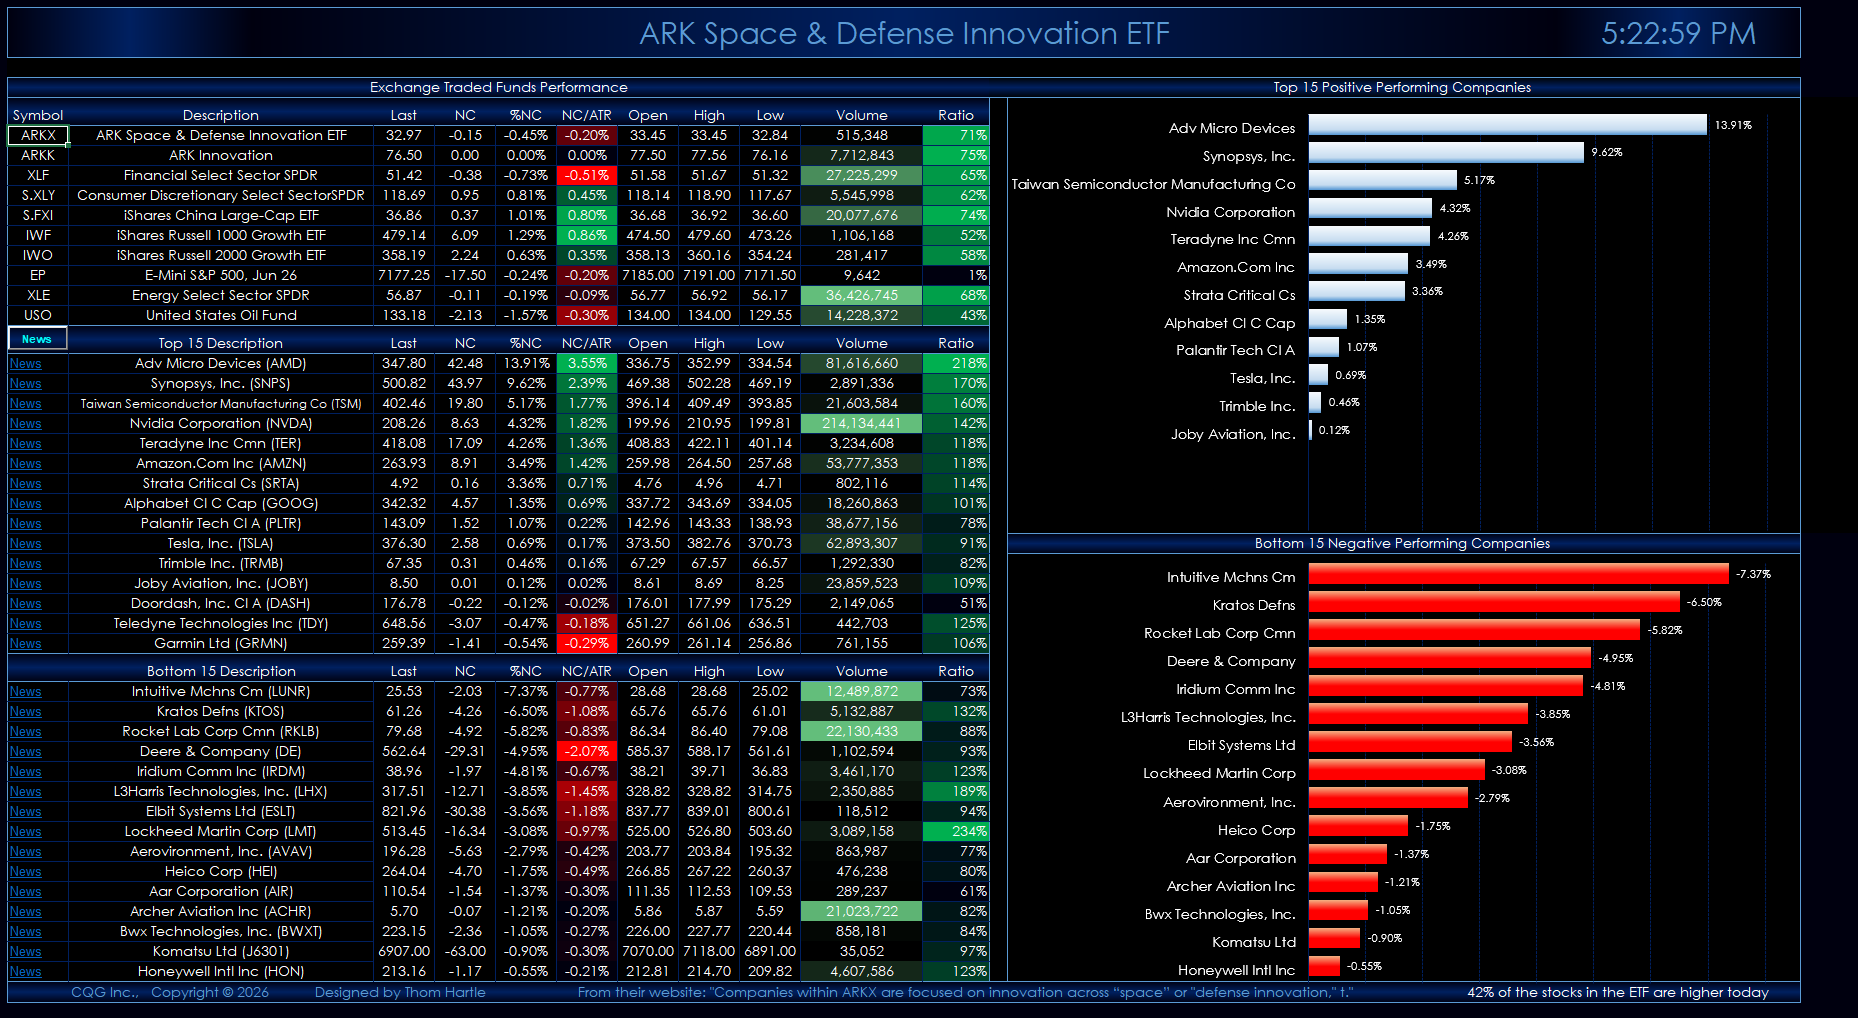
The top section of the quote display allows you to enter your own symbols.
The second section displays the top fifteen performers. The third section displays the bottom fifteen performers.
Quote data includes today's net change as a ratio to the 21-day Average True Range study. Next to today's traded volume is a column that calculates the ratio of today's volume versus the 21-day average of the volume. This ratio column gives you a sense of how active today's trading is. Readings of 100% and higher indicate active trading.
A key feature next to each company name is a link to Yahoo Finance. Clicking the News link will take you to the Yahoo page for that symbol. Note that this could take approximately 30 seconds to open in a browser. Turning off Extensions in your browser will make this happen faster.
If you open another Excel spreadsheet, then this dashboard will no longer be the active spreadsheet. The macro that updates the links and ranks the stocks by performance will stop. To start the macro, simply click the News toolbar button in the first column.
The fund is actively managed. The current holdings are as of 4/26/2026. There is a Symbols tab with instructions detailing where to download the latest posted spreadsheet with the current holdings and steps update the dashboard.
One company, JD LOGISTICS INC (Hong Kong Symbol: 2618) is not available in CQG. Another company, Thales (Symbol: S.FR.HO), trades on the Euronext Cash Last Price.
Make sure to lower your Excel Realtime Data (RTD) throttle to 100 milliseconds or lower. Learn how to do that here.
Requires CQG Integrated Client or CQG QTrader, data enablements for the NYSE, Nasdaq stocks, Euronext Cash Last Price, and Excel 2016 or more recent locally installed, not in the Cloud.