
If Microsoft Excel is an app that you utilize for building market screening dashboards then you might periodically require updating the symbols used in the dashboards. For example, using an Excel dashboard to track the current session's market performance of the constituents of the NADAQ 100. To be current you would likely open a browser and view a source that lists any changes to the NASDAQ 100.
The point of this post is to explain that Excel has an Add-in functionally where you can add an add-in, such as "Wikipedia." As an example, right from Excel you can check for any changes in the NASDAQ 100.
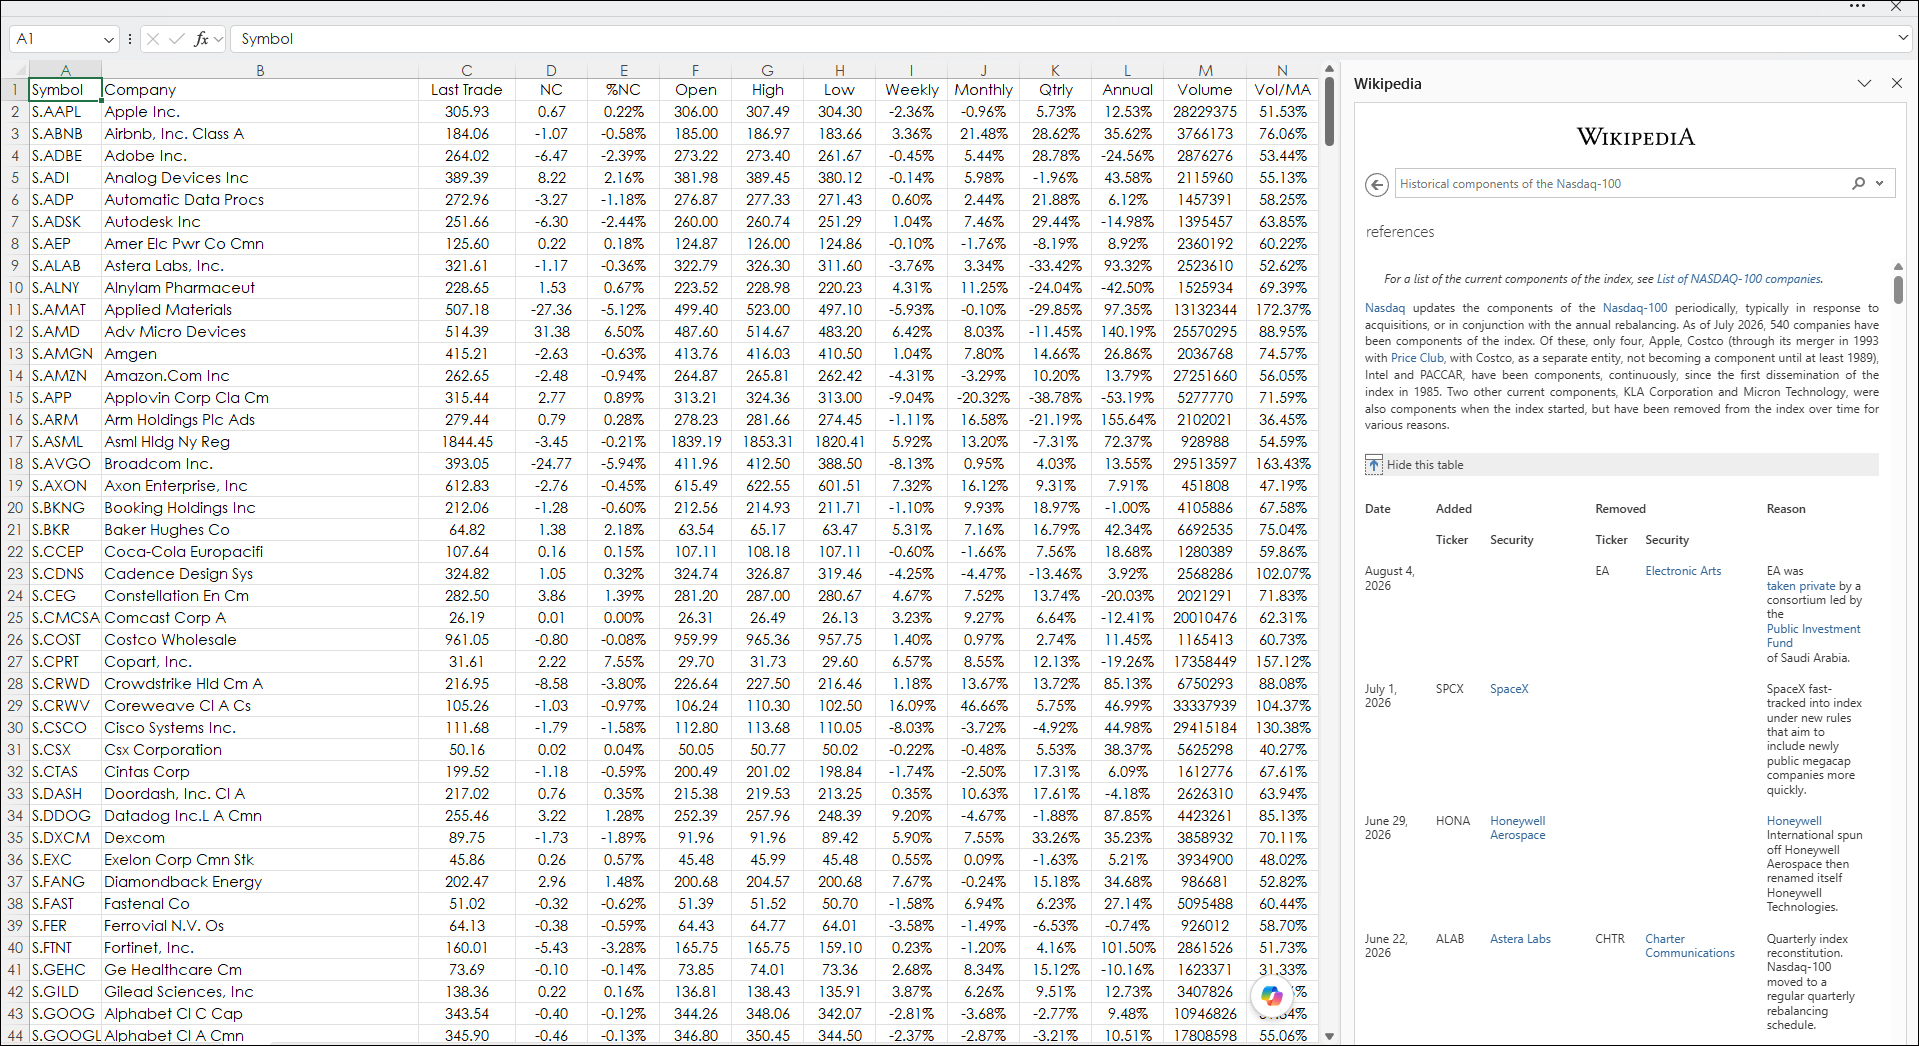
In the image below the "Wikipedia Add-In" has been installed and asked for "Historical components of the Nasdaq-100". The table listed all changes in the NASDAQ 100 including the reasons for the change. The table displays the changes as far back as February 2007.
To add the Wikipedia Add-In, click "Add-In" on the Home tab of the Excel Ribbon (over to the far right) and then enter "Wikipedia" in the search bar.
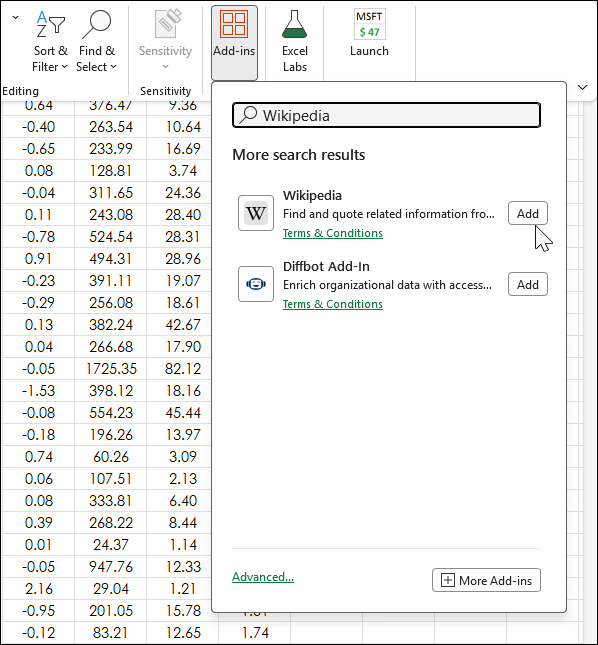
The Wikipedia Add-In may not be listed, just click "+ More Add-ins" and a window opens from the Microsoft Store, and the Add-in can be found there.
There are other add-ins available, such as the "FRED" Add-In which is short for Federal Reserve Economic Data. It is a free online database run by the Federal Reserve Bank of St. Louis and provides hundreds of thousands of economic data time series from scores of national, international, public, and private sources.
Requires Excel 2016 or more recent locally installed, not in the Cloud.