Excel's GROUPBY function offers the ability to create a summary of data. The data can be grouped, aggregated, sorted, and filtered based on the fields you specify.
The syntax of the GROUPBY function is:
GROUPBY(row_fields,values,function,[field_headers],[total_depth],[sort_order],[filter_array],[field_relationship])
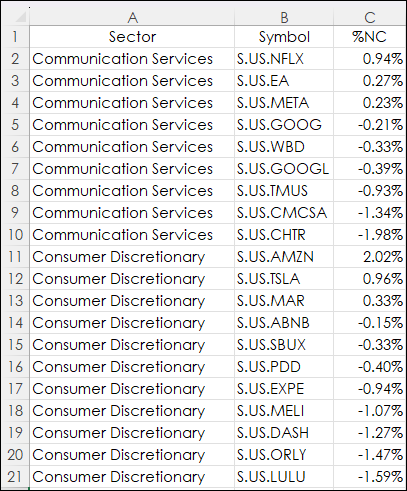
This post uses the GROUPBY function to determine the stocks in the NASDAQ 100 that are arranged by sectors and identify the stock with the maximum percentage net change and the stock with the minimum percentage net change within each sector during the current session.
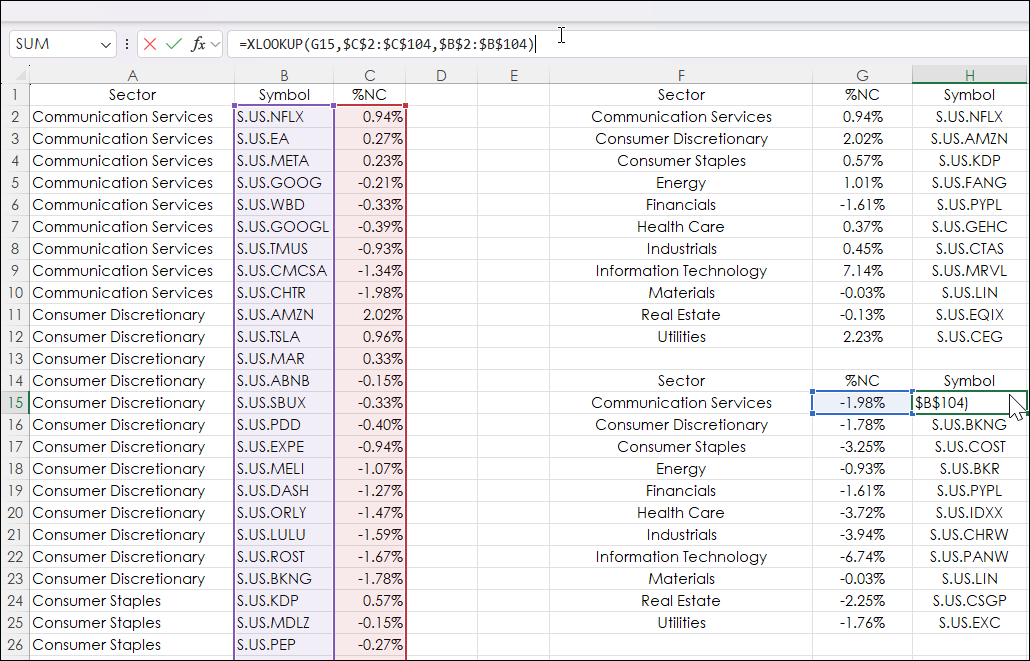
The 11 Sectors are listed in column A, the symbols for each Sector are in column B and using RTD percentage net change for each stock for the current session are listed in column C.
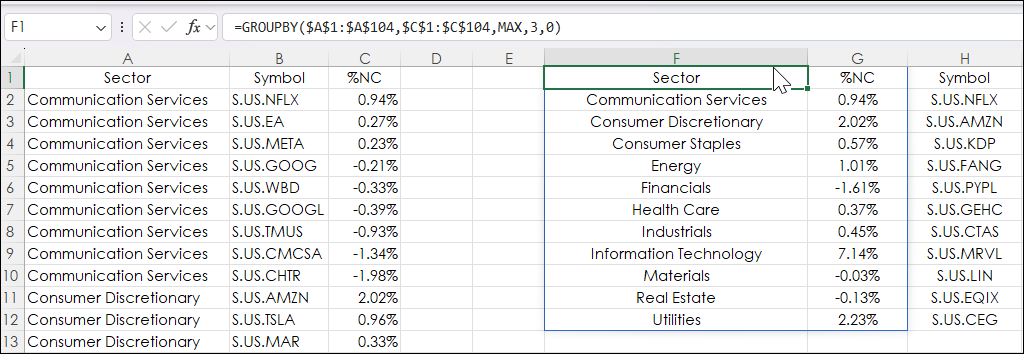
The Excel formula using the GROUPBY function is entered into cell F1. The function is finding the Maximum (MAX) percentage net change for each sector and spills down.
=GROUPBY($A$1:$A$104,$C$1:$C$104,MAX,3,0)
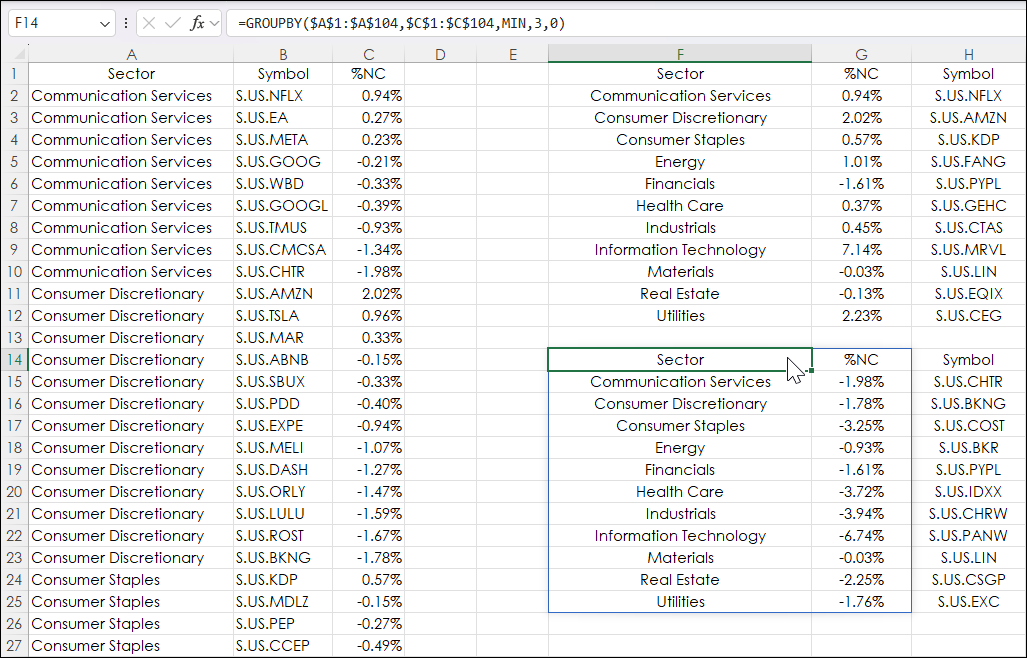
The Excel formula using the GROUPBY function is entered into cell F14. The function is finding the Minimum (MIN) percentage net change for each sector and spills down.
=GROUPBY($A$1:$A$104,$C$1:$C$104,MIN,3,0)
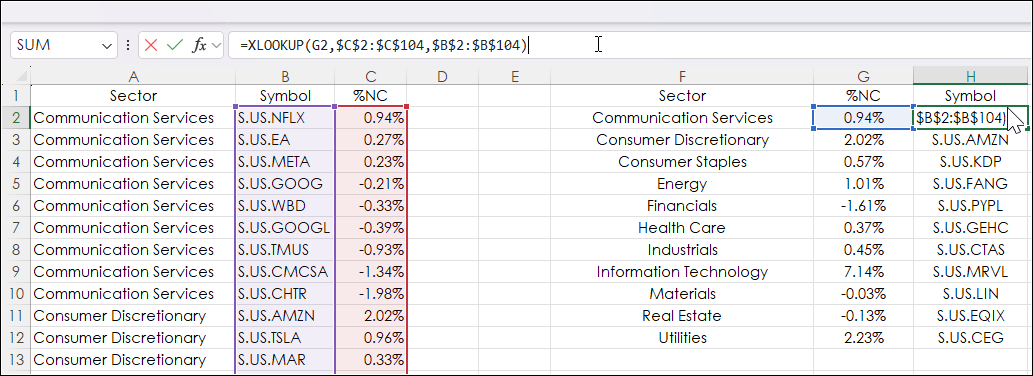
Then, using the XLOOKUP Function the symbols are reversed engineered from Columns C and B using the percentage net change to find the symbol.
=XLOOKUP(G2,$C$2:$C$104,$B$2:$B$104)
The XLOOKUP function is copied and pasted down from cell H2 to H12.
The Excel function to find the symbol for the Minimum percentage net change for the session is entered into cell H15 to H25.
=XLOOKUP(G15,$C$2:$C$104,$B$2:$B$104)
Cells J2 to N12 are pulled from the Maximum by Sector and the Minimum by Sector tables.
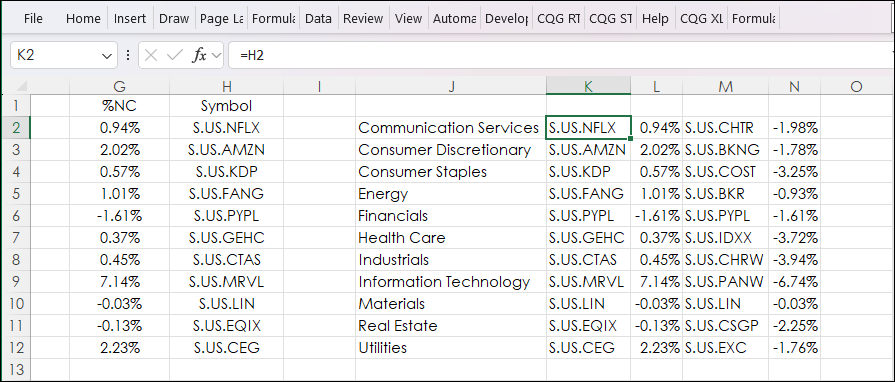
The table on the Data tab is used for the quote blocks on the Market Display tab. The blocks display the session's performance for each Sector and the symbol from the NASDAQ 100 that is the best performer and the symbol that is the worst performer by Sector.
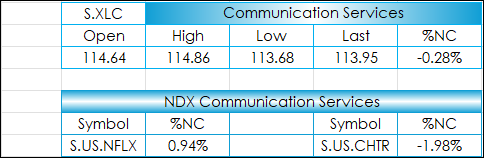
The entire table looks like this below.
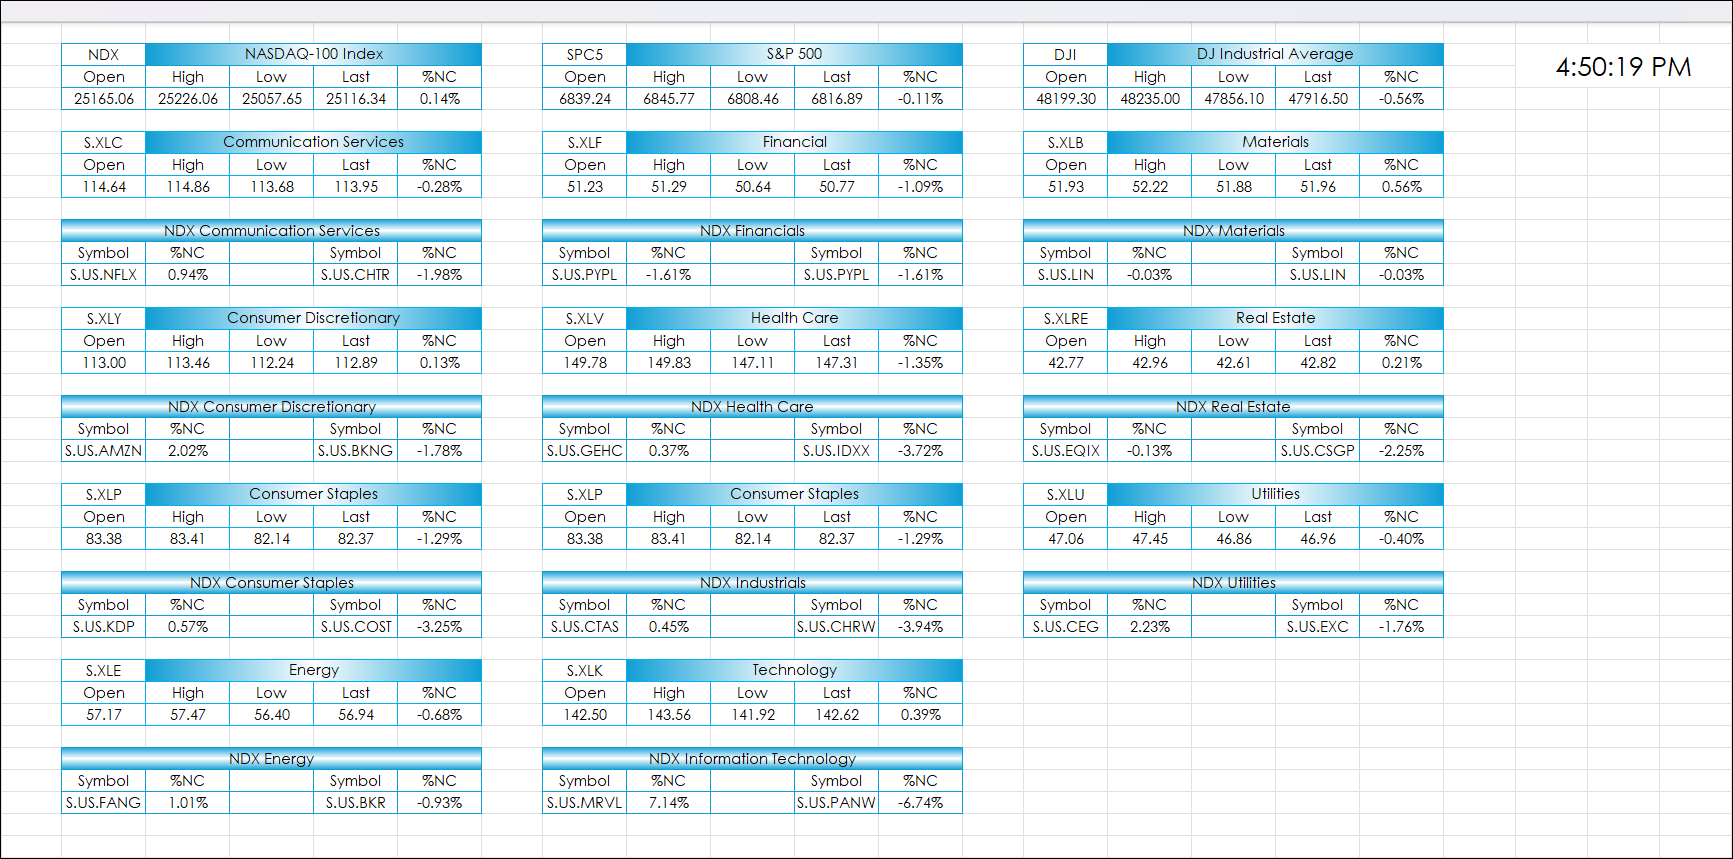
Note: The NASDAQ 100 is known for its focus on technology with 40 companies in the Information Technology Sector and just one company (Paypal Holdings, S.US.PYPL) in the Financial Sector, and just one company (Linde Plc, S.US.LIN) in the Materials Sector.
This post introduced using Excel's GROUPBY function to group NASDAQ 100 market data by Sectors and then determine the Maximum and Minimum performers within the Sector for the session. Excel's XLOOKUP function was used to extract the symbol matched to the Maximum and Minimum data points.
Requirements: CQG Integrated Client or QTrader, enablements for the NASDAQ Exchange and NYSE American, and Excel 365 (locally installed, not in the Cloud) or more recent.