This post walks through using Excel's XLOOKUP with Min, Median, and Max Functions to create a summary table of market performance for the forward curves of Soybeans, Soybean Meal, Soybean Oil, Corn, and Wheat markets. Any markets can be used that have forward curves. Below is the Soybean block.
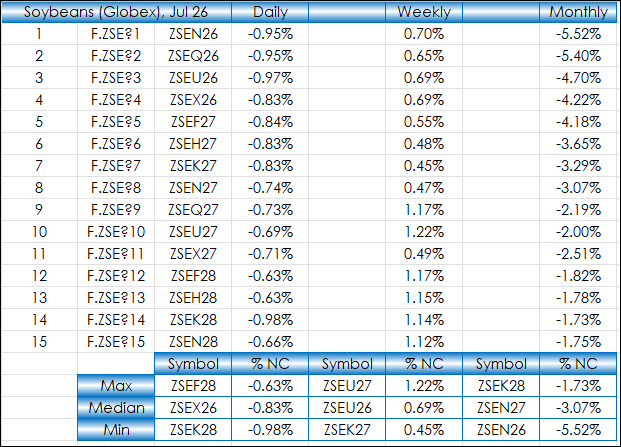
The first two columns above produce wild card symbols for Soybeans. The third column converts the wild card to a symbol:
=RTD("cqg.rtd", ,"ContractData", B2, "Symbol",, "T")Next, the Daily column is the percent net change for the current session. The deferred contracts may not have a trade and if so, then the midpoint of the best bid and ask are used compared to yesterday's settlement for an estimate of the percent change (if there is not a bid and ask then a blank cell is returned):
=IFERROR(IF(IFERROR(ROUND(RTD("cqg.rtd", ,"ContractData",C2, "PerCentNetLastTrade",, "T")/100,5),"")="",ROUND((((RTD("cqg.rtd",,"ContractData",C2,"Bid",,"T")+RTD("cqg.rtd",,"ContractData",C2,"Ask",,"T"))/2)-RTD("cqg.rtd",,"ContractData",C2,"Y_Settlement",,"T"))/RTD("cqg.rtd",,"ContractData",C2,"Y_Settlement",,"T"),5),IFERROR(ROUND(RTD("cqg.rtd", ,"ContractData",C2, "PerCentNetLastTrade",, "T")/100,5),"")),"")The Weekly column uses the weekly percent bar change for the specific contract:
=IFERROR(ROUND(RTD("cqg.rtd",,"StudyData",B2, "PCB","BaseType=Index,Index=1", "Close", "WW","0","all",,,,"T")/100,5),"")The Monthly column uses the monthly percent bar change for the specific contract:
=IFERROR(ROUND(RTD("cqg.rtd",,"StudyData",B2, "PCB","BaseType=Index,Index=1", "Close", "MM","0","all",,,,"T")/100,5),"")The summary table at the bottom of the block uses Excel Max functions:
=ROUND(MAX(D2:D16),5)
The summary table at the bottom of the block uses Excel Median functions:
=ROUND(MEDIAN(D2:D16),5)
The summary table at the bottom of the block uses Excel Min functions:
=ROUND(MIN(D2:D16),5)
Then the symbols section of the summary table looks for the values of the three Excel functions and returns the respective symbol for each value:
=XLOOKUP(D18,$D$2:$D$16,$C$2:$C$16,0,0)
The full Excel sheet is shown below:
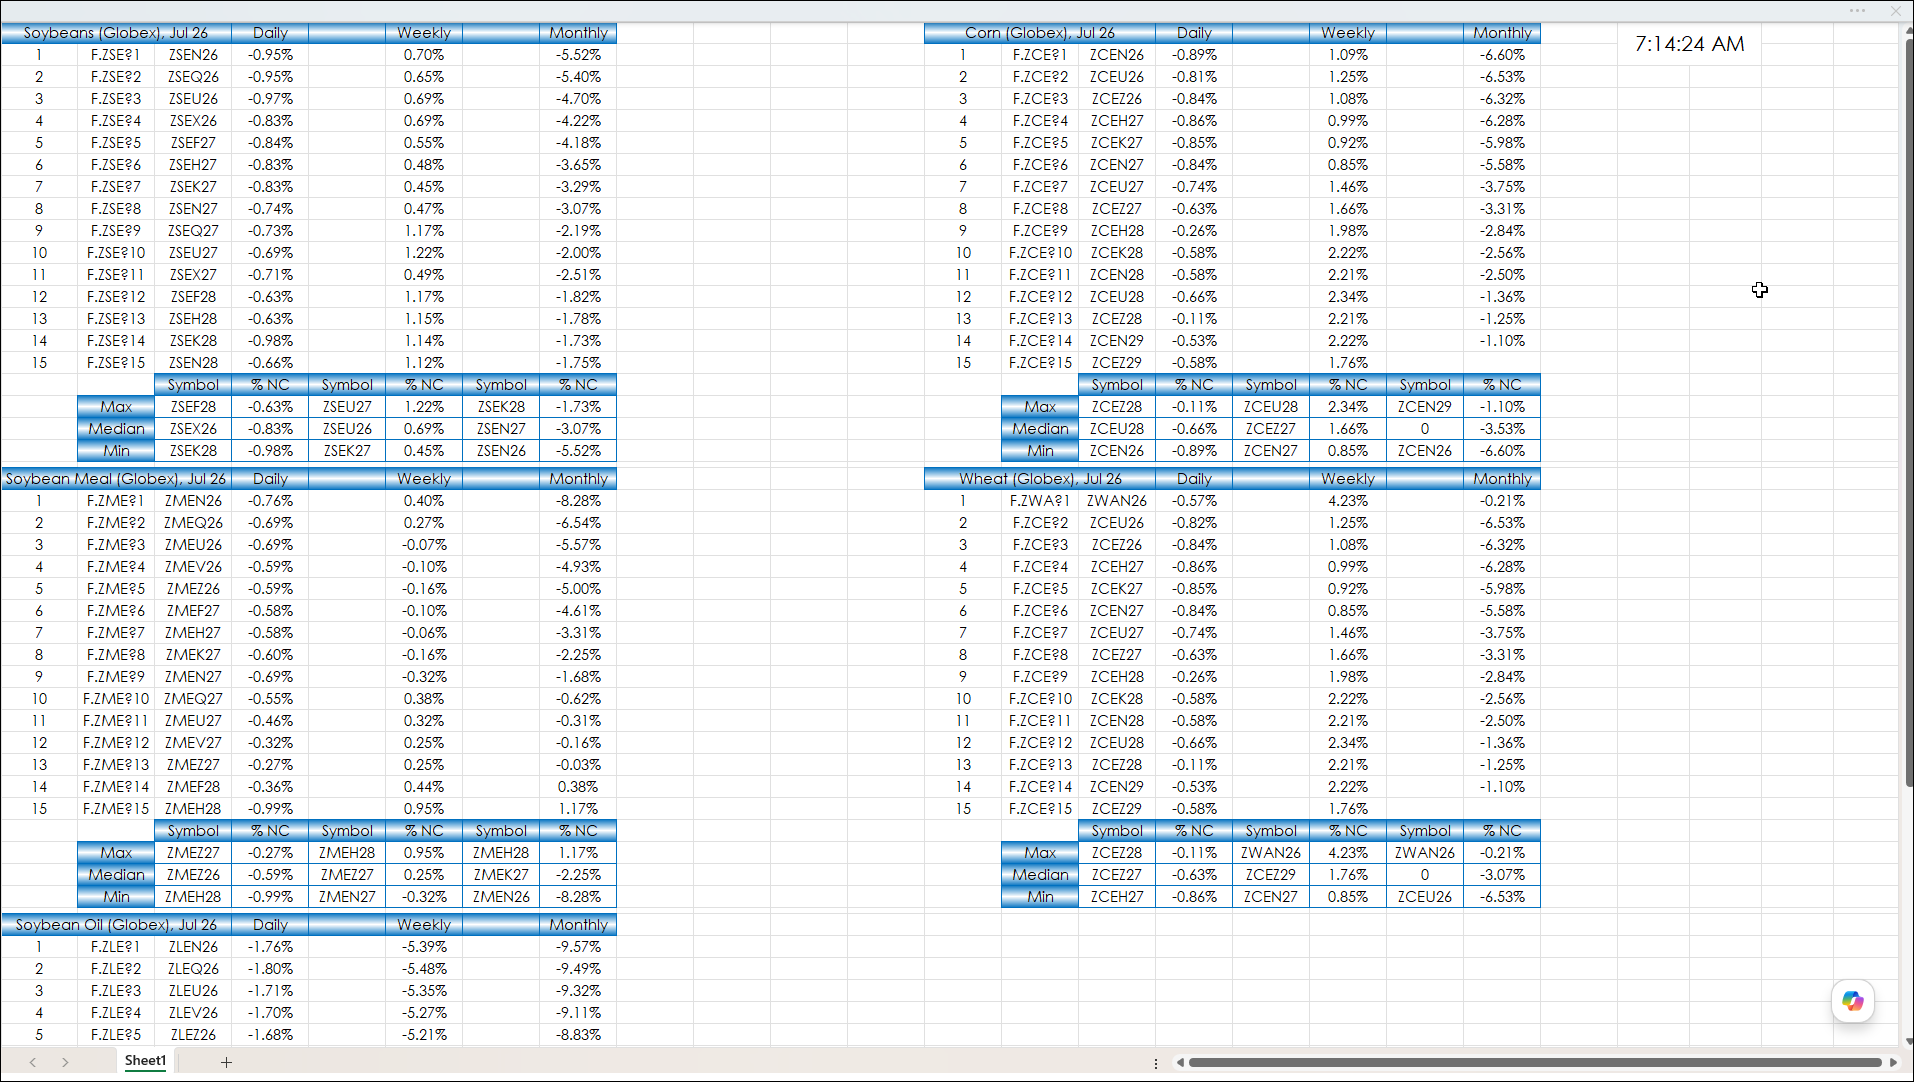
As there is no shortage of market data, knowing functions such as the ones detailed in the post can aid by creating summary tables using the Excel functions.
Requires CQG Integrated Client or CQG QTrader, data enablement for the various exchanges, and Excel 365 or more recent locally installed, not in the Cloud.