
This post details an Excel dashboard for measuring the Z-Score of stocks from the NASDAQ 100. The dashboard sets the parameters as user defined inputs for the time frame, the average lookback period and the standard deviation lookback period. The Z-Score is calculated using the Excel STANDARDIZE function: Z = (Close -Average)/Standard Deviation
=STANDARDIZE(x, mean, standard_dev)
Traders use this statistical calculation to measure exactly how "extreme" the current price is relative to its recent past, regardless of the asset's actual dollar value. Determining the difference between the close and the average and then dividing by the standard deviation normalizes the value.
There are two tabs, the Data tab performs calculations on the stocks from the NASDAQ 100 and the Main tab displays four blocks of data. The data is the top 5 stocks with the highest Z-Scores and the bottom 5 stocks with the lowest Z-Scores. The user can enter the time frame and the average period and the standard deviation period for each block enabling a multiple time frames view.
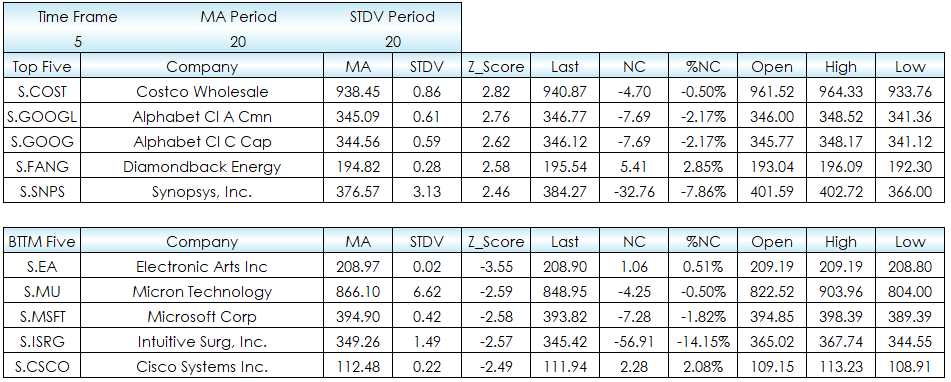
The data tab uses RTD and Excel functions.
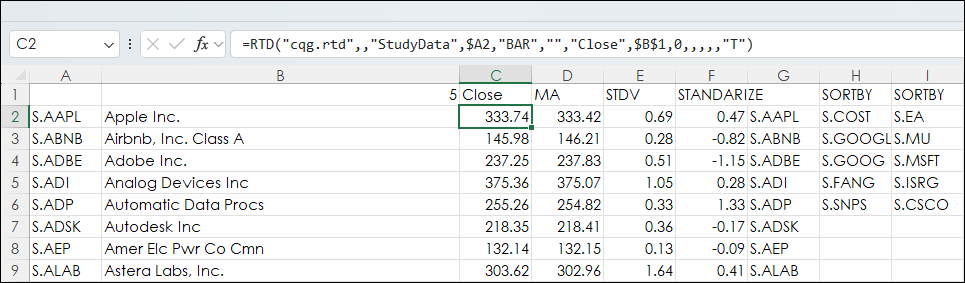
Column C for the first block pulls in the close for each symbol using the Time Frame in cell B1 pulled from the Main tab:
=RTD("cqg.rtd",,"StudyData",$A2,"BAR","","Close",$B$1,0,,,,,"T")Column D for the first block pulls in the moving average for each symbol using the Time Frame in cell B1 pulled from the Main tab and the period from the Main tab:
= RTD("cqg.rtd",,"StudyData", $A2, "MA", "InputChoice=Close,MAType=Sim,Period="&Main!$D$7&"", "MA",$B$1,,"all",,,,"T")Column E for the first block pulls in the standard deviation average for each symbol using the Time Frame in cell B1 pulled from the Main tab and the period from the Main tab:
= RTD("cqg.rtd",,"StudyData",$A2, "StdDev", "InputChoice=Close,Period1="&Main!$D$7&"", "STDDEV",$B$1,,"all",,,,"T")Column F calculated the Z-Score:
=STANDARDIZE(C2,D2,E2)
Column H sorts the Z-Scores in descending order, takes the top 5 and returns the symbols:
=CHOOSECOLS(TAKE(SORTBY(F2:G104,F2:F104,-1),5),2)
Column I sorts the Z-Scores in ascending order, takes the bottom 5 and returns the symbols:
=CHOOSECOLS(TAKE(SORTBY(F2:G104,F2:F104,1),5),2)
On the Main tab in the first block the top five symbols are pulled from the Data tab beginning with cell B9:
=Data!H2
The RTD call for the company name is pulled using the symbol in cell B9.
=PROPER(RTD("cqg.rtd", ,"ContractData",B9, "LongDescription",, "T"))The moving average value is in cell F9 and uses the VLOOKUP function applied to the Data tab:
=VLOOKUP(B9,Data!$A$2:$D$104,4,FALSE)
The standard deviation is in cell G9 and uses the VLOOKUP function applied to the Data tab:
=VLOOKUP(B9,Data!$A$2:$E$104,5,FALSE)
The Z-Score is in cell H9 and uses the VLOOKUP function applied to the Data tab:
=VLOOKUP(B9,Data!$A$2:$F$104,6,FALSE)
The Bottom 5 repeats the same process using the symbols from Column I starting with cell B16:
=Data!I2
=PROPER(RTD("cqg.rtd", ,"ContractData",B16, "LongDescription",, "T"))=VLOOKUP(B16,Data!$A$2:$D$104,4,FALSE)
=VLOOKUP(B16,Data!$A$2:$E$104,5,FALSE)
=VLOOKUP(B16,Data!$A$2:$F$104,6,FALSE)
The remainder of the block is the standard RTD calls for Last, NC, %NC, Open, High, and Low.
An additional two blocks at the bottom of the dashboard allows two symbols to be entered.

This next image is the full dashboard.
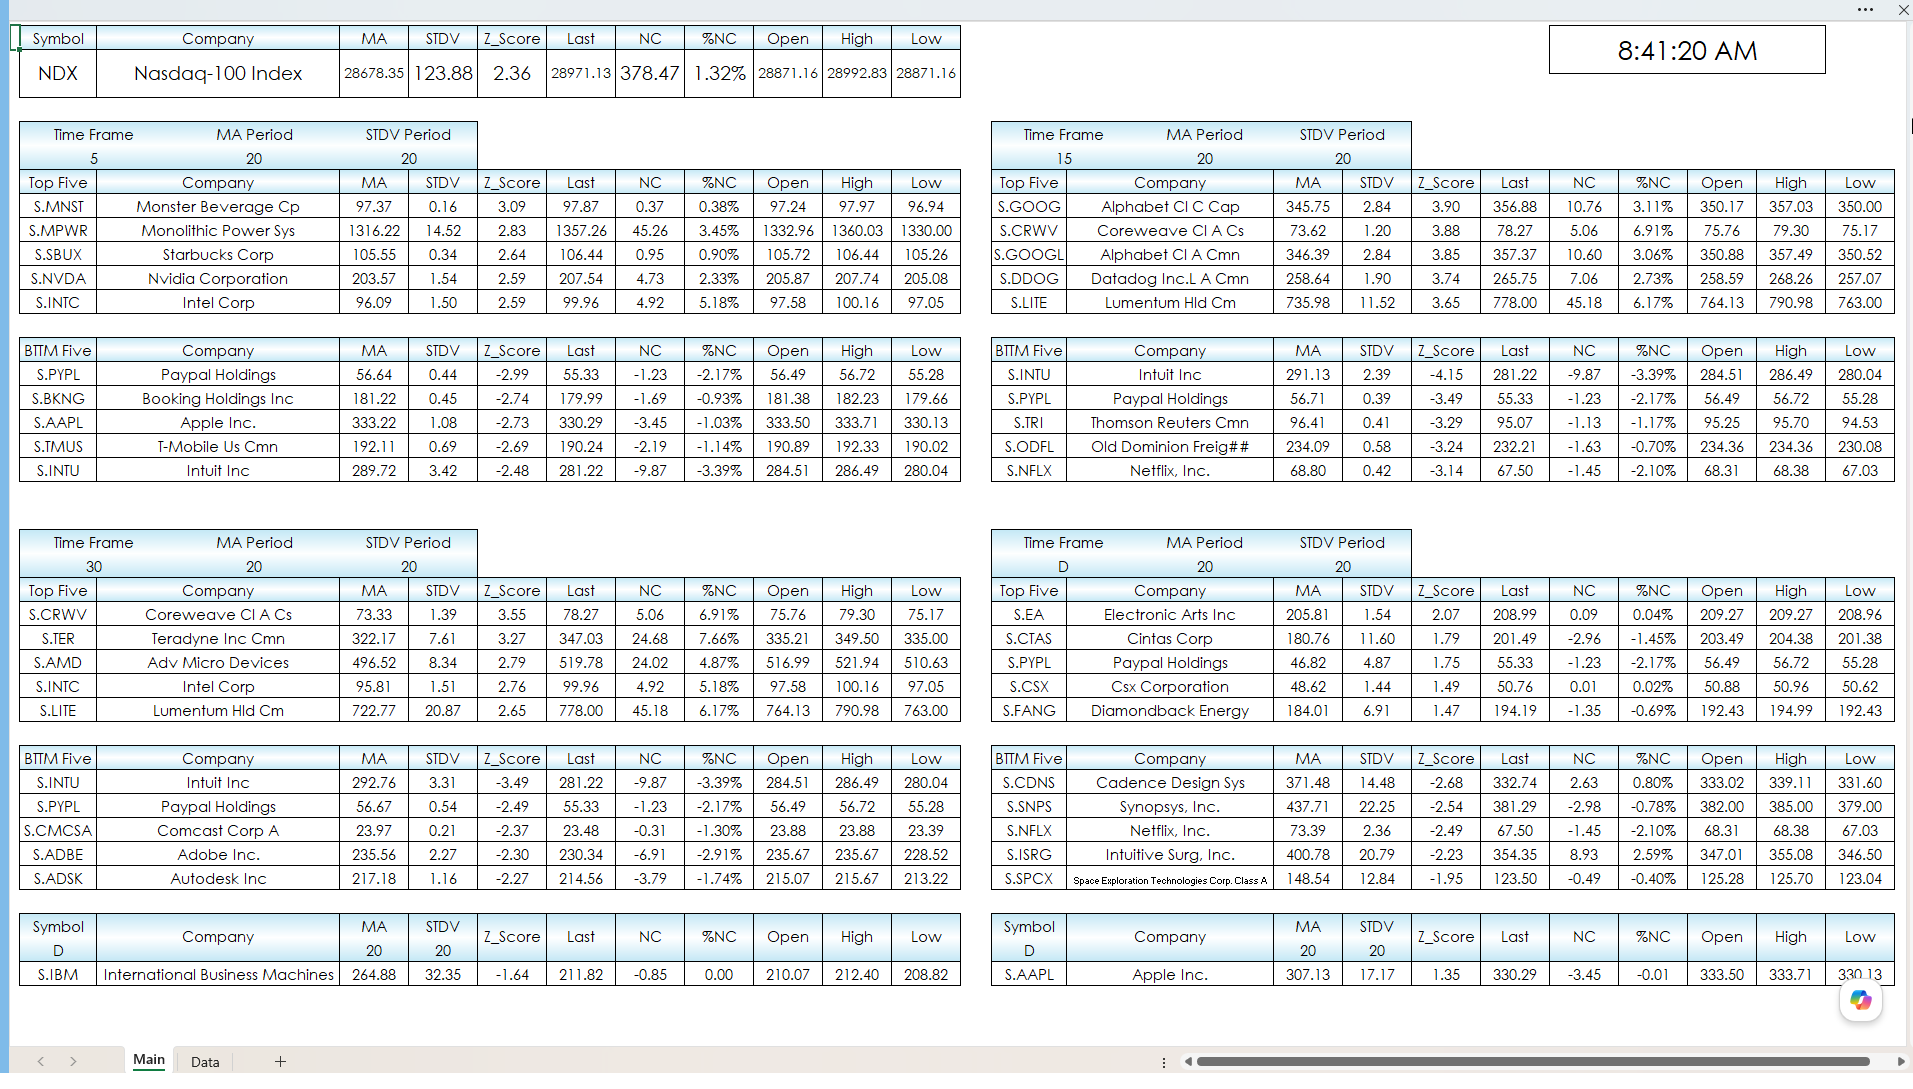
This post was another dashboard displaying Excel's ability to screen large amounts of data and produce a filtered version for further inquiry.
Requires CQG Integrated Client or CQG QTrader, data enablements for the NYSE and Nasdaq stocks, and Excel 2016 or more recent locally installed, not in the Cloud.