A popular quote display for following a group of contracts in a particular commodity is the CQG All Contracts display. This post details the steps to replicating this display in Excel.
First, an overview of the All Contracts display. Below the image displays the All Contracts window. Simply enter in a root symbol and the display populates all the current contracts. This display automatically rolls.
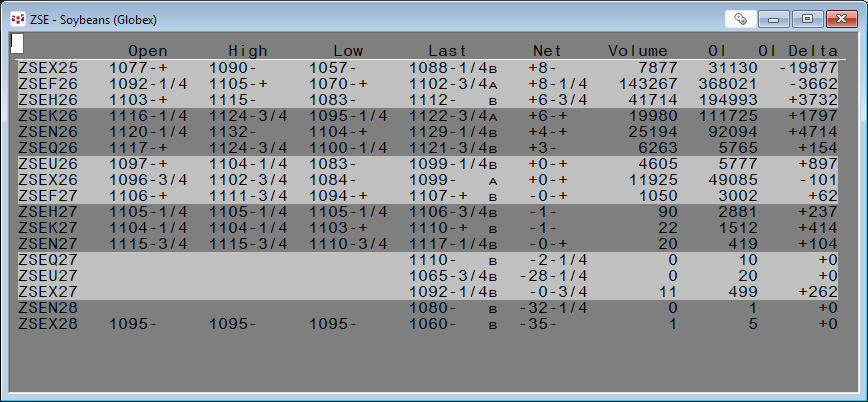
AllCon data includes:
- Open
- High
- Low
- Last: right-click AllCon to select bids/asks/trades or trades only
- Net change (Net)
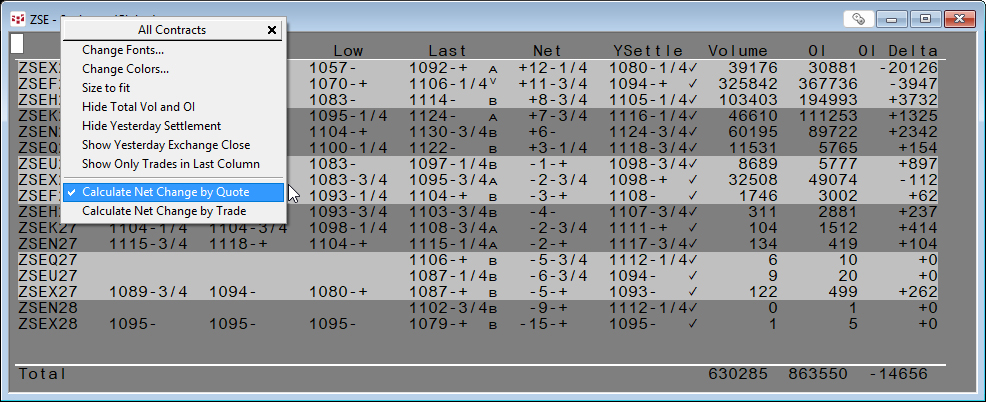
- Yesterday's Settlement (Prev): right-click AllCon to show and hide this column
- Exchange volume (Volume)
- Contract open interest from the previous day (OI)
- Net change of open interest from previous day (OI Delta)
- Total: right-click AllCon to show and hide totals
This link is to the All Contracts Help file.
Right-click on the display opens the menu below to configure the display.
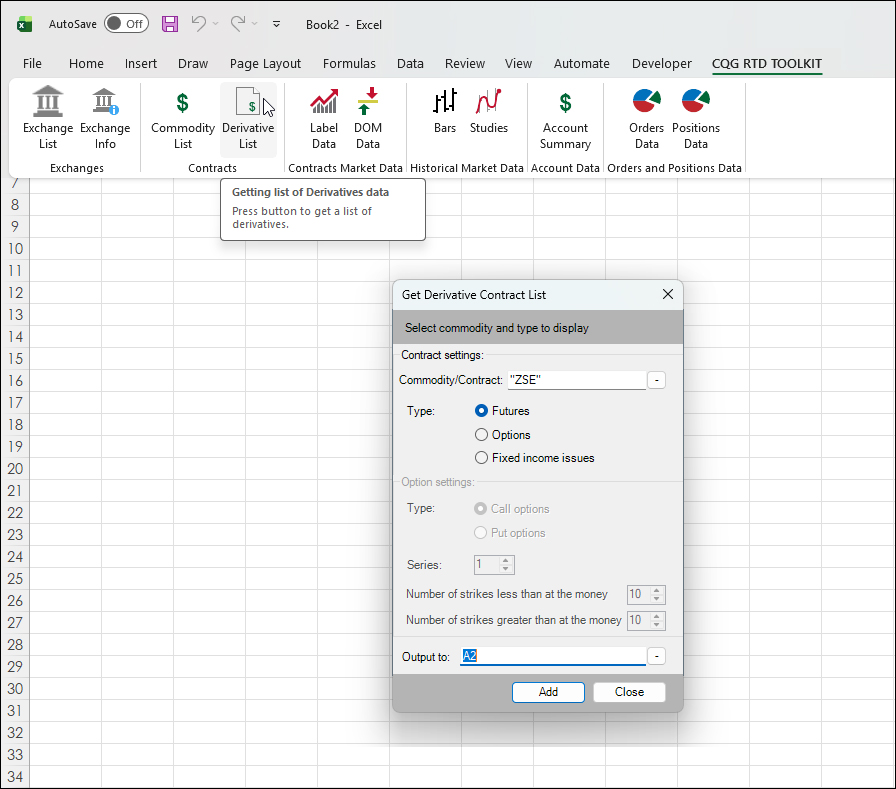
To create an Excel version starts with using the CQG RTD TOOLKIT, select Derivative List, and in the UI enter the symbol (here, "ZSE"), select Futures, and the cell for the first symbol (A2) in the list of symbols. The start is cell A2 so the column can have the label "Symbol" added.
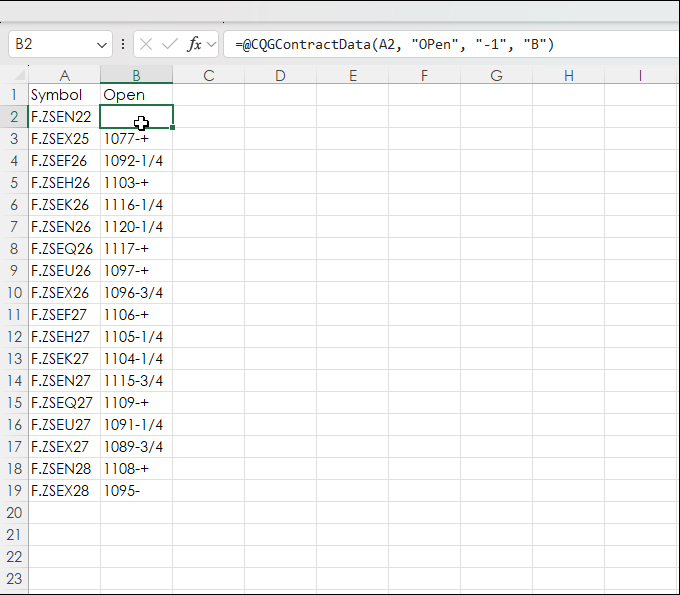
With the symbols added to column A, the next step is select "Label Data", enter cell A2 for the first symbol, in the Contract labels window enter open, select Open, the Format output is BATE, and the output is to cell B2.
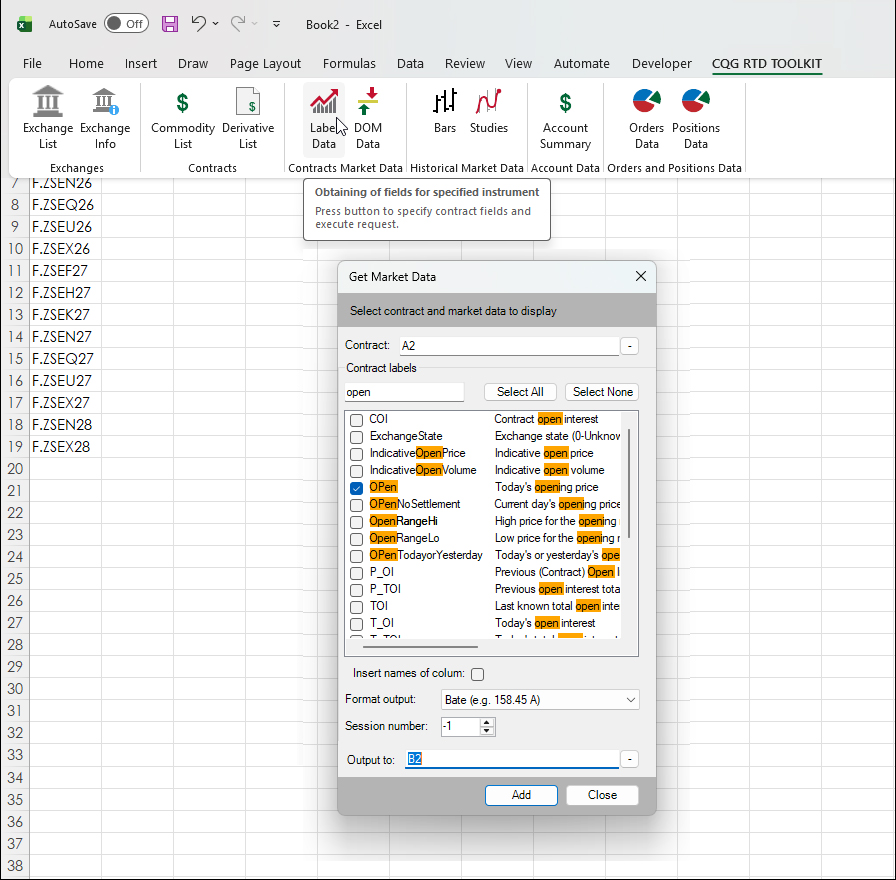
Cell B2 is selected, copy and paste down to cell B19. Symbol is added into cell A1, and Open in cell B1.
Notice that cell B2 does not display a value. There is a bug in the CQG RTD TOOLKIT. The Add-In pulls an expired contract for the first cell. The Workaround is the second row will be hidden.
This process is repeated for the remaining columns.
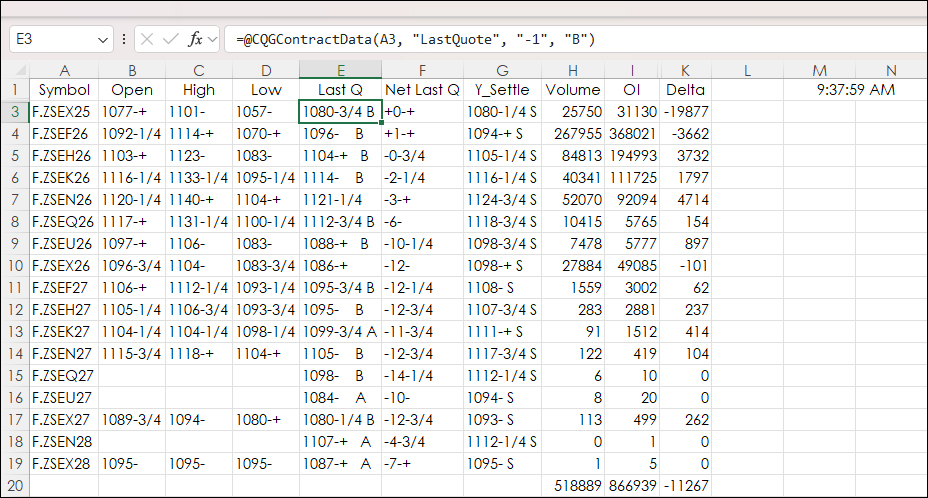
The downloadable sample has two tabs: Last Quote and Last Trade. This is the same as the All Contracts display. The Last Quote uses Net Last Quote and Last Trade uses Net Last Trade.
Last Trade.
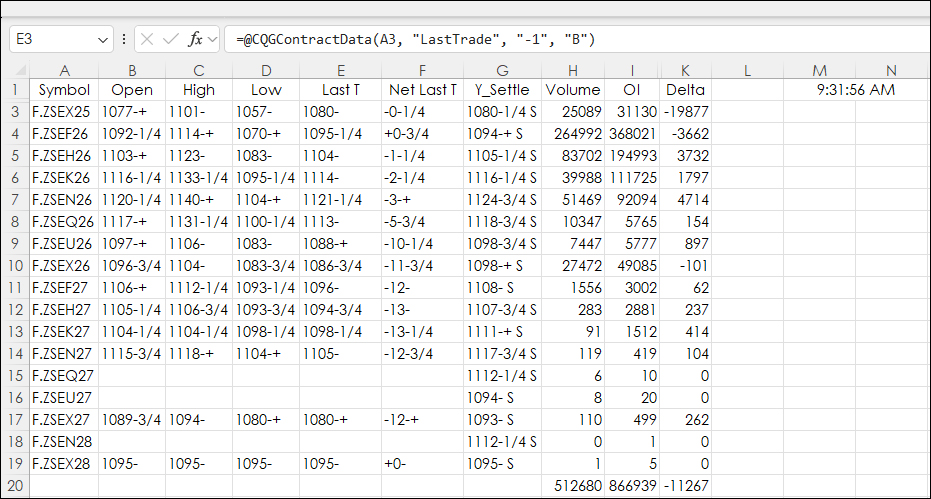
The Toolkit does not have the previous session's open interest. The following RTD formula pulls in the open interest in column J (hidden), and the Delta (column K) is the difference between column I and Column J.
=RTD("cqg.rtd",,"StudyData",A3, "Bar",, "ContractOI", "D", "-2",,,,,"T")To modify this spreadsheet for your markets, replace the symbols in column A using the Derivative List with your symbol (Use all capital letters) and copy and paste or delete the other rows down to line up with the symbols.
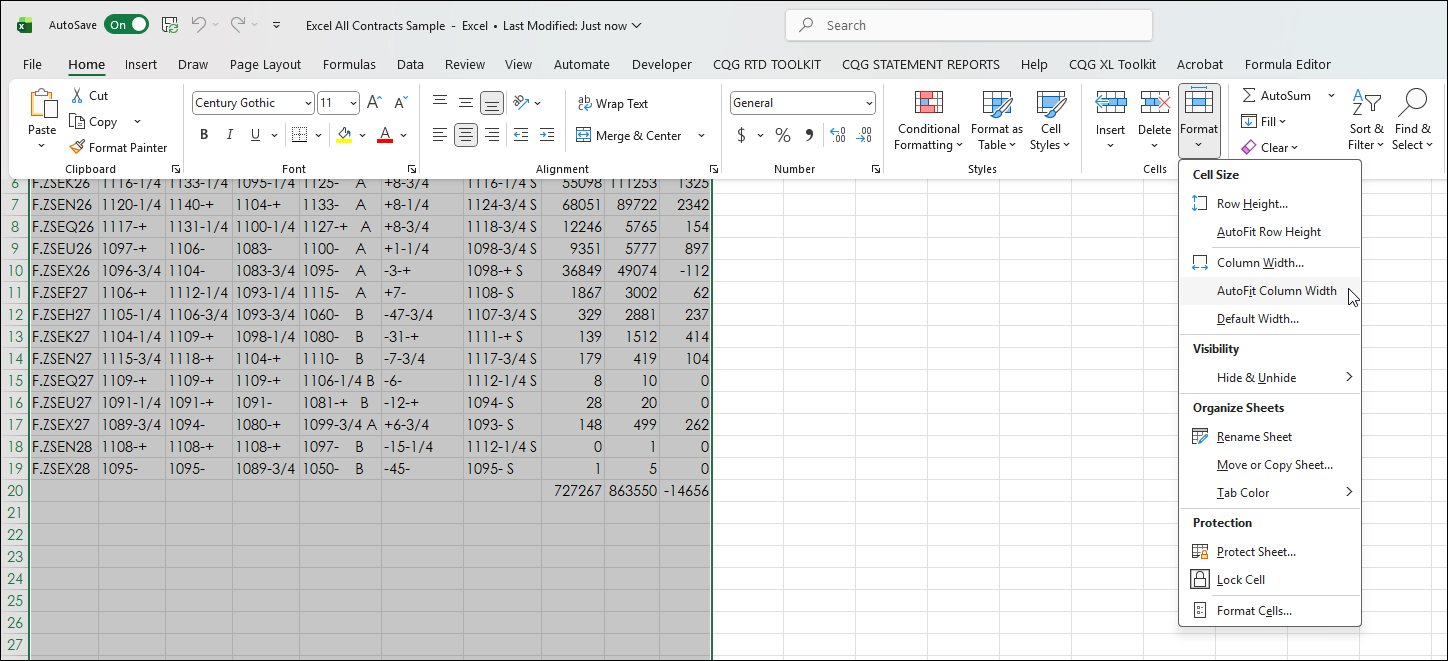
If the columns are too narrow for the prices, then select the columns, select Home, then Format, and then AutoFit Column Width.
The Excel dashboard can be modified to include other markets or studies data.
Requires CQG Integrated Client or CQG QTrader, and Excel 2016 or more recent locally installed.