Definition
The average range for each bar's time of day is computed over a user-defined period. For example, on a 30-minute chart, the 12 p.m. bar has its range calculated over the last n days. Then the highest and lowest value of range for that time of day is computed over a much larger sample of bars. The difference between the current range is recorded against the highest and lowest range, and depending on the difference, an exponential moving average is calculated. This average is given a user-defined minimum and maximum range which in the examples in the chapter are between a three and twenty-one period. The conclusion is that if, range is narrow in relationship to the history of that time of day, the average slows, but if range is large, the average speeds up. Due to the often-large differences in range between consecutive intraday bars the differences in the speed of the average from one bar to the next can be considerable.
Comparison with Adaptive Moving Averages
The performance of the average has similar characteristics to an adaptive moving average in that it will speed up when price trends (especially if range expands for the time of day as well) and slows down in sideways action. The adaptive average will often lose all movement in sideways and move horizontally. In a trend they can behave in contrasting fashion. Adaptive averages will simply accelerate with a trend whilst the Time Average will do likewise in association with the time of day. This means there will be times when it is more sensitive than the Adaptive and others when it is slower.
The other key difference is that because the Time Average is always looking back to the previous period's time of day the current bar's average is already computed and does not move when we look at the current bar. This means there is always a fixed reference point.
Concept of a moving average that adjusted based on the:
- time of the day,
- range,
- comparison between that range and the long-term average of range to create a dynamic average.
However, whilst this is flexible, it does little to help in understanding risk and extremes. Once again in order to try and understand extremes 1,2 and 3 standard deviations are placed around the variable average.
Time Average Bands versus Bollinger Bands
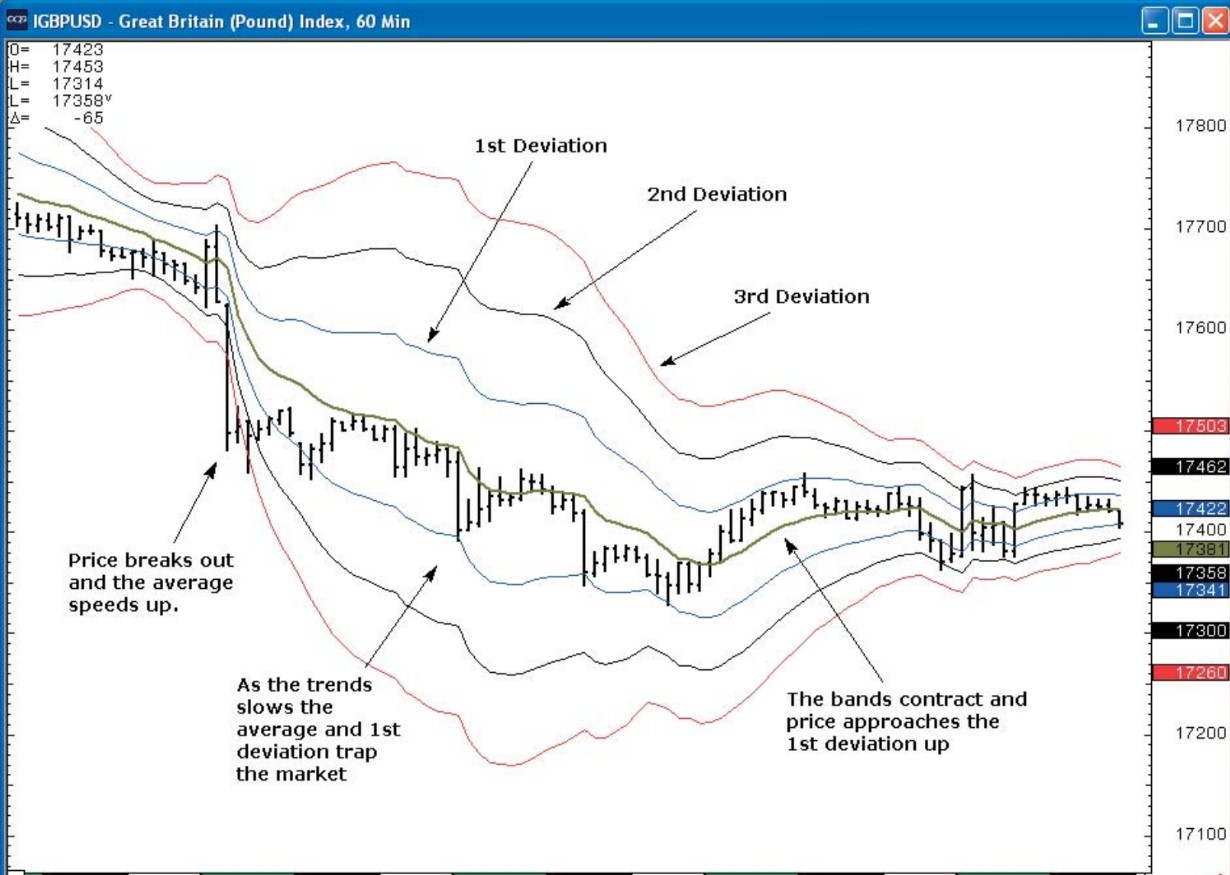
Given that the moving average changes on every bar and looks at the relationship between range as opposed to the close-to-close, the behaviour of the standard deviations is significantly different from how a traditional Bollinger Band would perform. The first major difference is that the Time Average Bands normally do not expand in opposite directions in a strong trend. This is because of the differences in analysing range instead of the close. This is a far more stable relationship as the differences in range are not as large as the difference between one close and the next. Typically, if the market trends up, this will cause the average to rise and the top bands will expand upwards as well, but the bottom bands will also move higher. The only time that the bands will move in opposite directions is if there is a significant change in range. If the market then pauses and range contracts, it will take a considerable time for the bands to come back together. The example on the 60-Minute Cable chart shows the basic premise. The bands were close together before the economic number at 3 p.m. The effect of the number causes a huge expansion of range and prices close below the 3rd standard deviation down. The bands expand, indicating a strong breakout. However, subsequent to the initial break the market inevitably calms down and range contracts. From that point onwards the first deviation band down marks short-term exhaustion points and the moving average as a resistance point.
A breakout is indicated when Volatility Bands condense
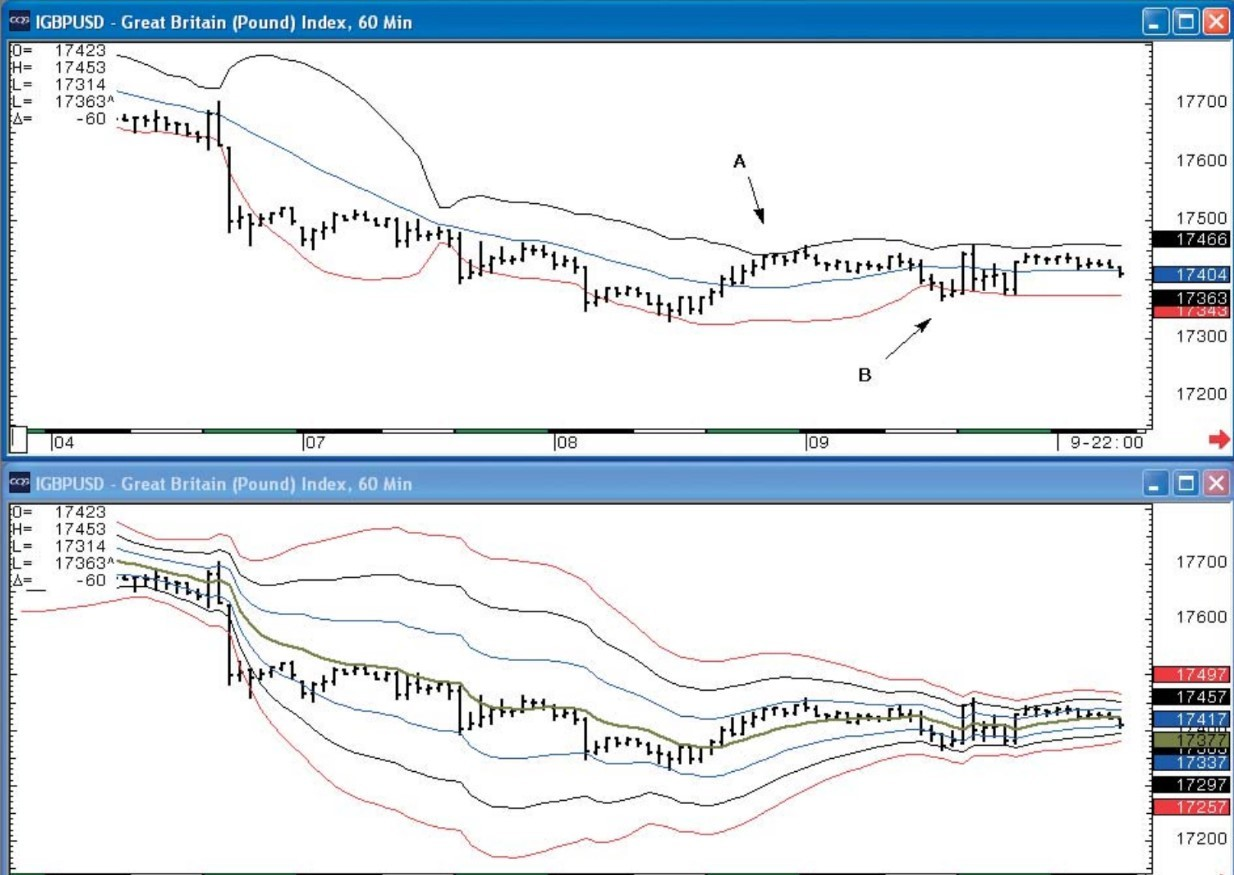
In a similar fashion to normal Bollinger Bands, periods when the Time Average Bands condense indicate that a breakout is due. A key difference is the frequency with which this happens. This is due to the greater length of time that it takes after a trend or an increase in range for a contraction to take place. Bollinger Bands can signal a false breakout as bands expand due to volatility from close-to-close while staying in a broadening sideways pattern. Time Average Bands typically require direction and expansion of volatility of range, thus adding an extra dimension. If we return to the Cable chart, in the subsequent sideways movement at point A, both the Bollinger 2nd standard deviation high and the Time Average Bands have the same resistance points and price holds. However, once again a close outside the Bollinger Band at B is still within the Time Average Bands and therefore prevents a false breakout. In fact price only reaches the 1st deviation down as the midline is the moving average. This highlights how normal bands suggest a trend breakout whereas the Time Average bands have those lows as support points.
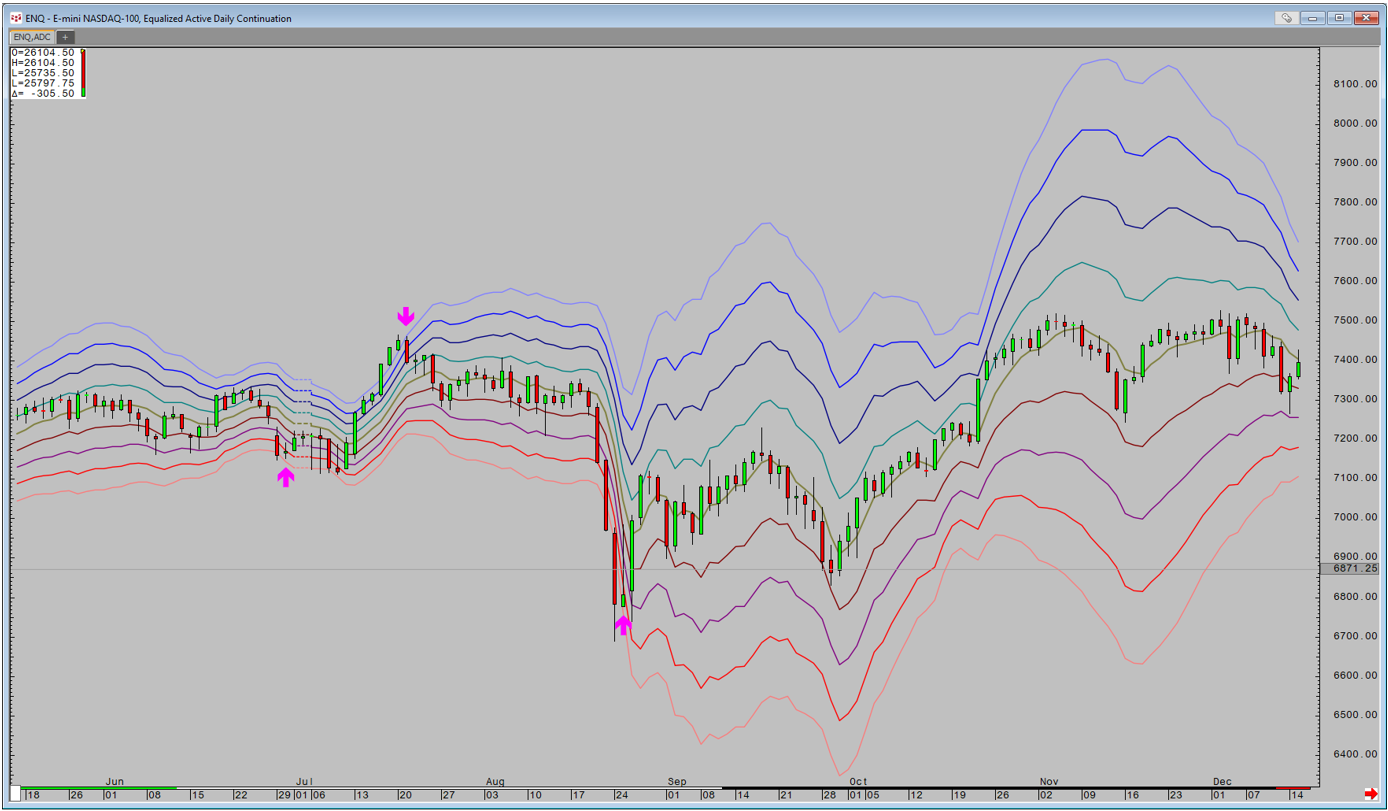
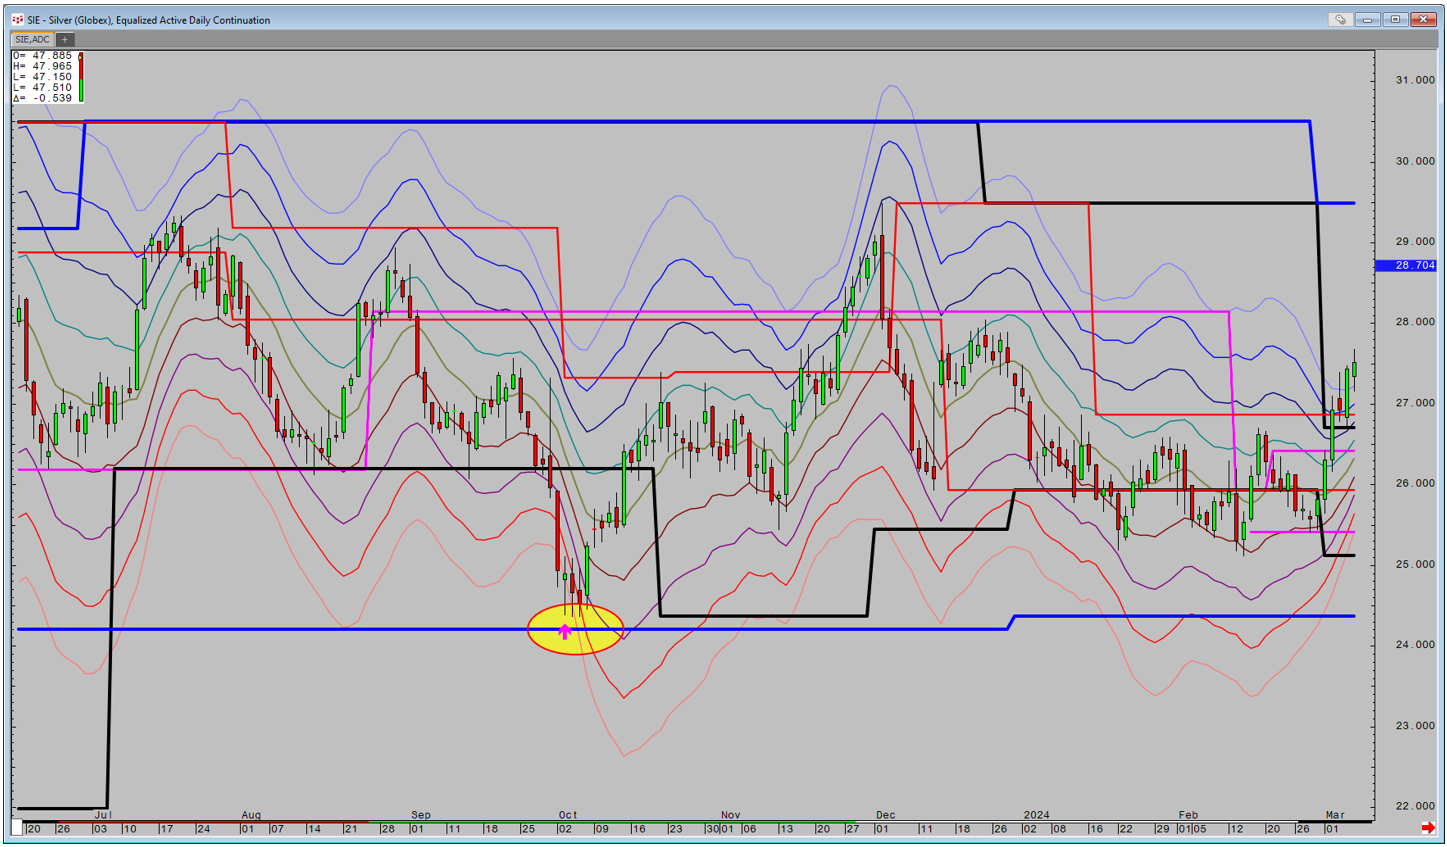
It is possible to add a 4th Deviation within the setup which allows for code to be built that I call BullWhip and BearCage. It is relatively simple stating that price has closed beyond the 4th Deviation and then returned within the Bands. There are two types of signals. One is that signals a false breakout after a period of consolidation which has made the Bands narrow. The second is when we get an explosive sudden trend. The Nasdaq chart shows 3 signals. This pattern can also be connected to the Peak Energy and Expansion studies which qualify multiple timeframe support and resistance. The Silver chart shows that we are approaching major monthly based support (blue line) after a sharp fall, before a BullWhip signal catches the low.