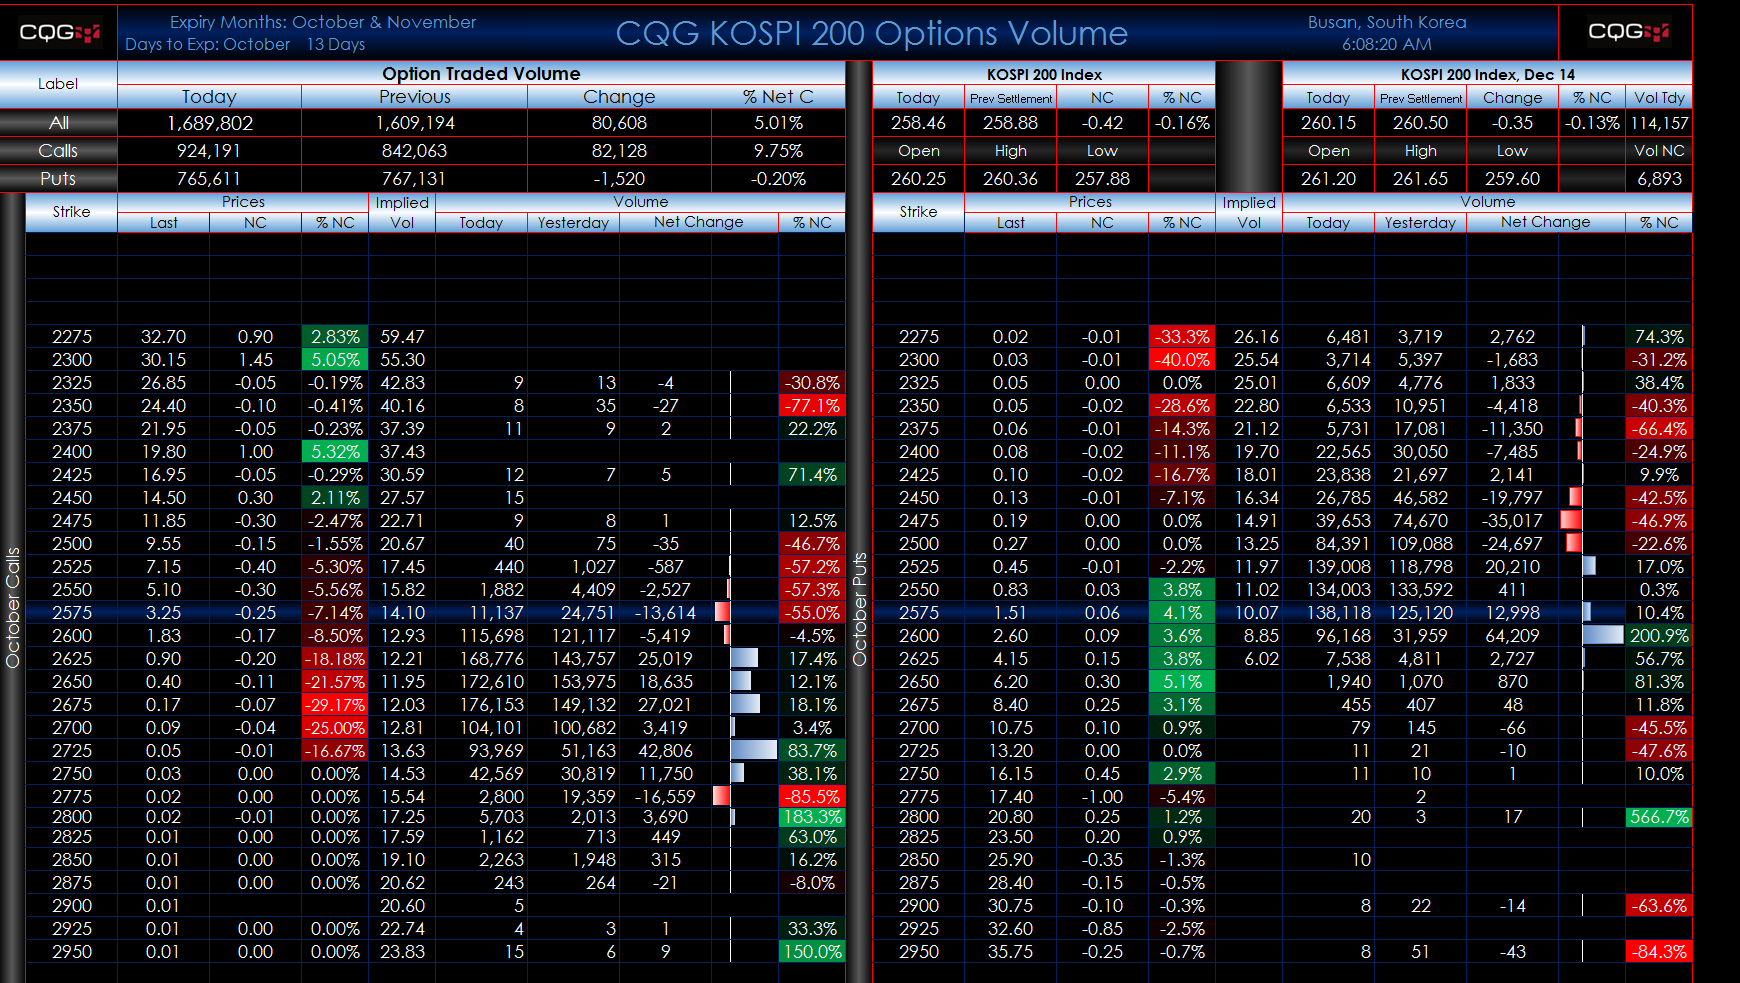
This Microsoft Excel® dashboard displays the first two months' expiries of the KOSPI 200 options. Last price, net change, percent net change, implied volatility using Black-Scholes, and today's and yesterday's volume data are automatically displayed. In addition, the total amount of contract volume for calls and puts as well as call volume and put volume are displayed. Price net change and volume net change columns are heat-mapped. The at-the-money option is highlighted and sixteen strikes above and below are displayed.
Make sure to lower your Excel RealTimeData (RTD) throttle to 0 milliseconds. Learn how to do that here.
Requires CQG Integrated Client or CQG QTrader, Korean Exchange data enablement, and Excel 2010 or more recent.