This Microsoft Excel® spreadsheet uses the CQG Toolkit to pull in market data. There is a Symbols tab where you can enter the symbols and the parameter for decimal formatting.
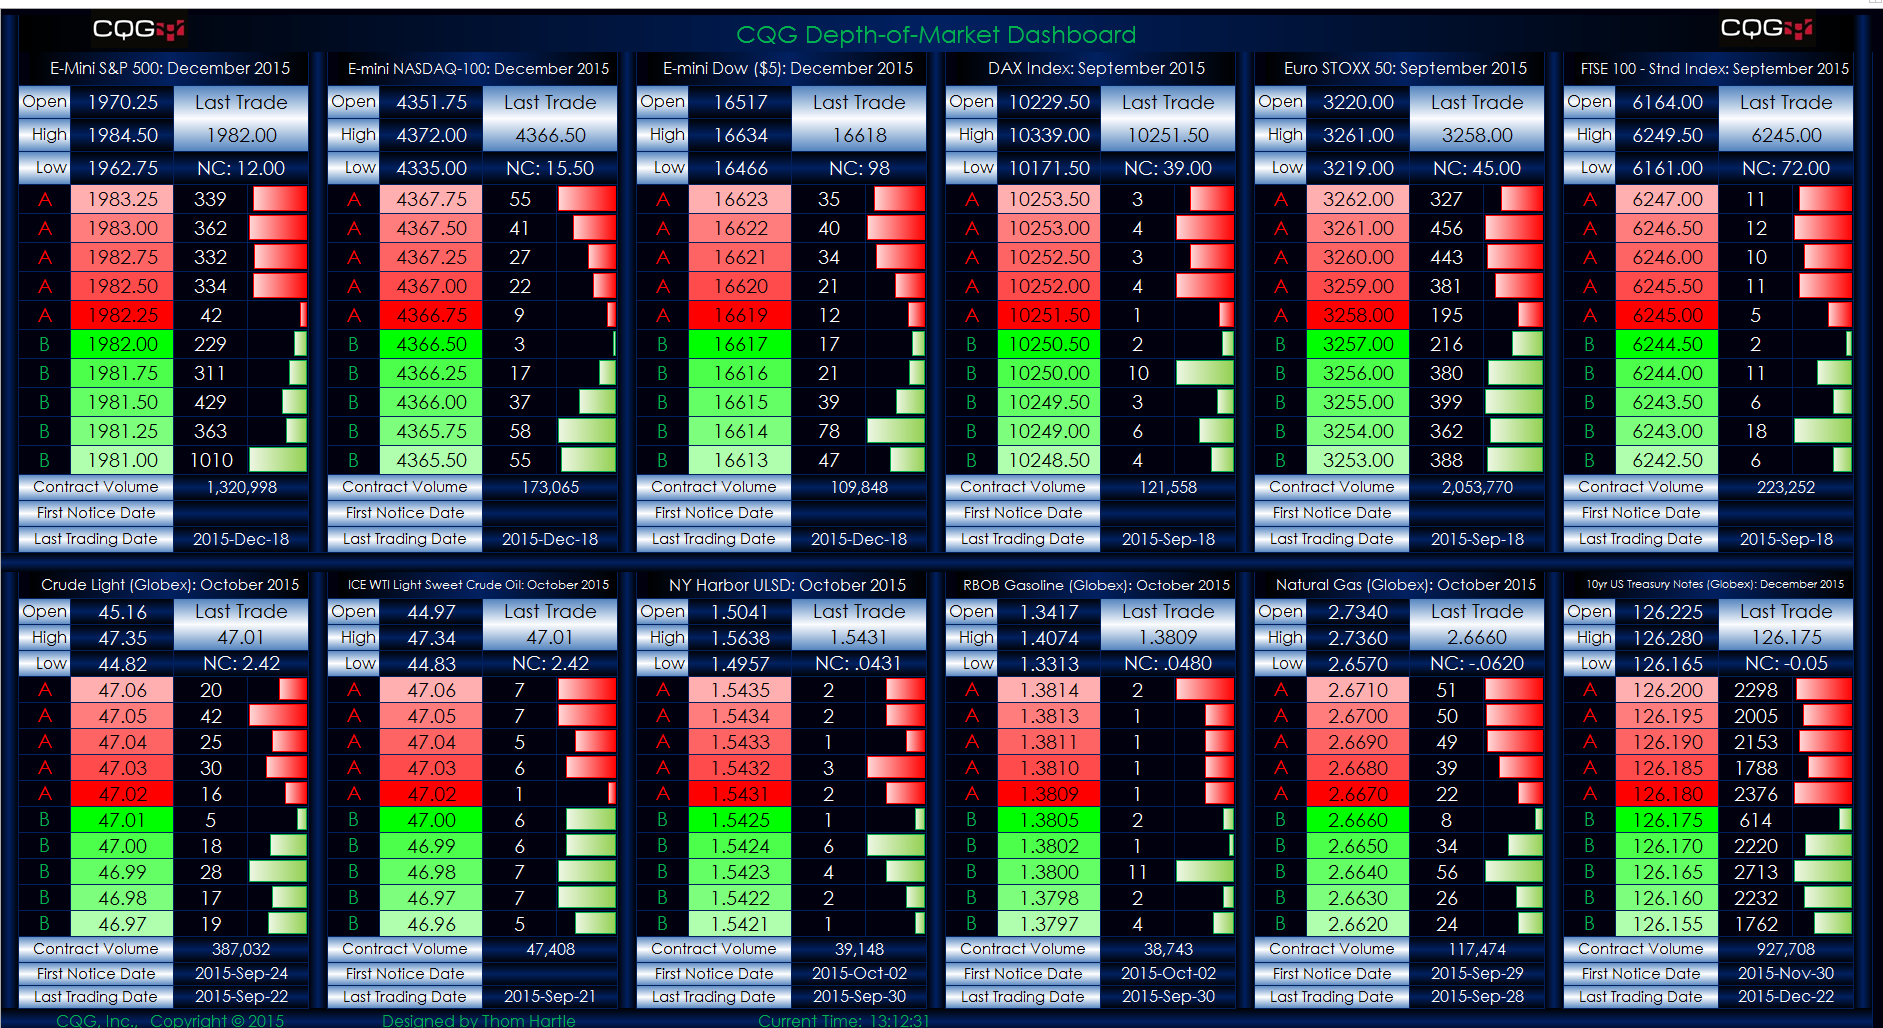
One of the features of the CQG Toolkit is the ability to display DOM data in Excel. This dashboard is an example of displaying DOM data and other market information.
Make sure to lower your Excel RealTimeData (RTD) throttle to 50 milliseconds. Learn how to do that here.
Requires an enablement turned on by your FCM and Excel 2013 or more recent. This product is copyrighted content owned by CQG.