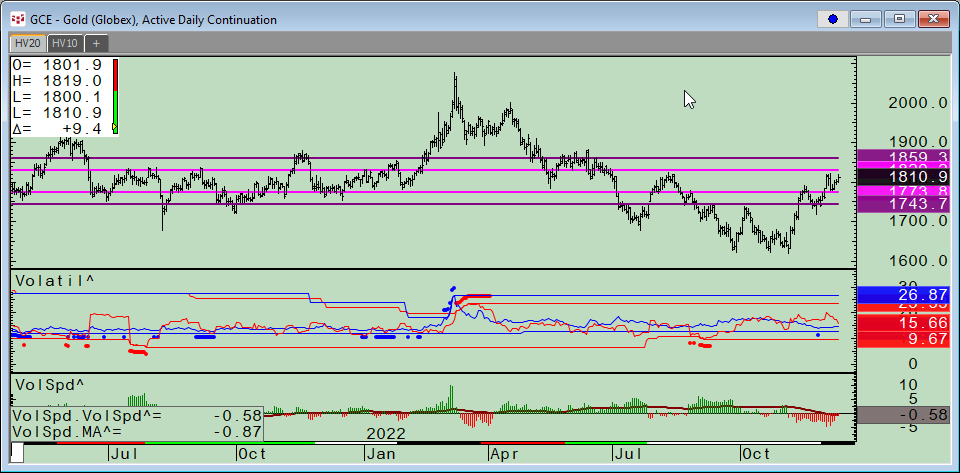
CQG Product Specialist Stan Yabroff designed a CQG page for customers to track and analyze a market’s implied volatility and historical volatility. This post details the features and functionality… more
Workspaces
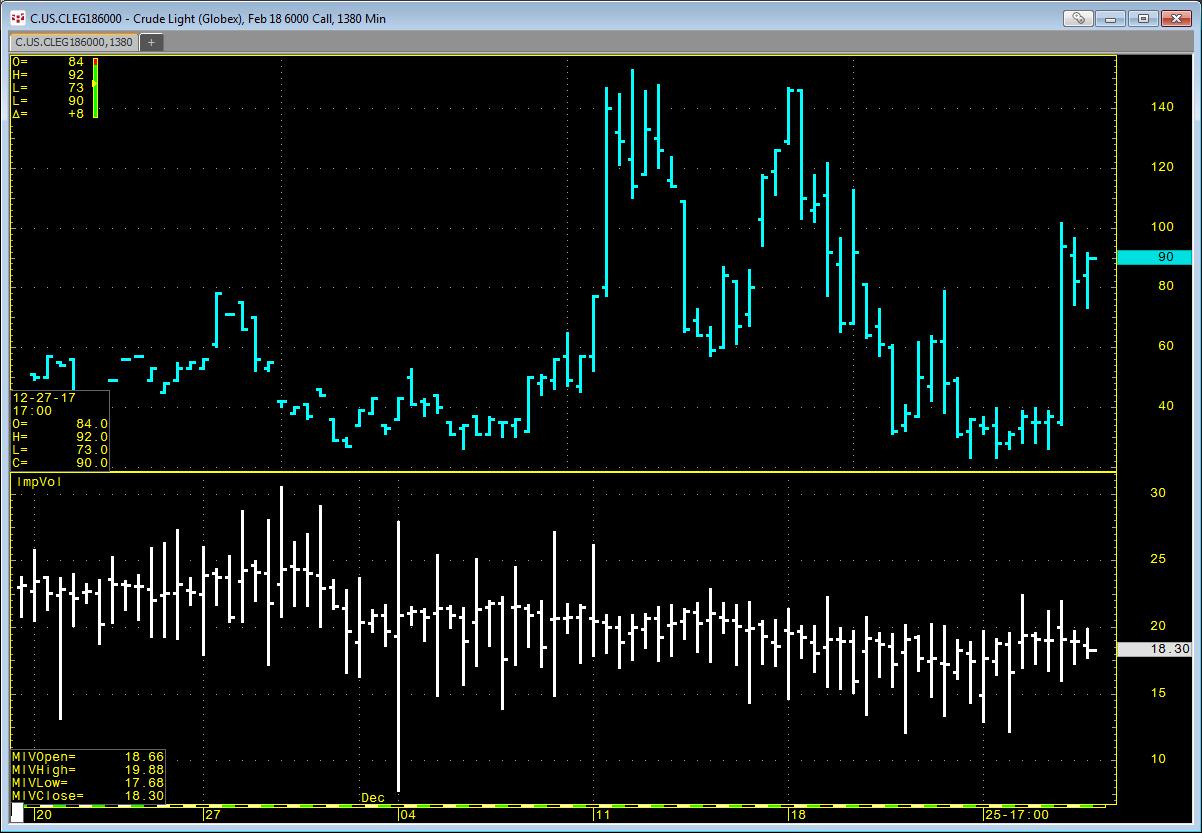
CQG offers an Implied Volatility (ImpVol) study that allows you to pull in historical implied volatility data onto a chart. ImpVol is not the implied volatility of one particular option.… more
Customers using our flagship product, CQG Integrated Client (CQG IC), have access to a new study called Algo Orders. Using a proprietary algorithm, this indicator of trading activity detects and… more

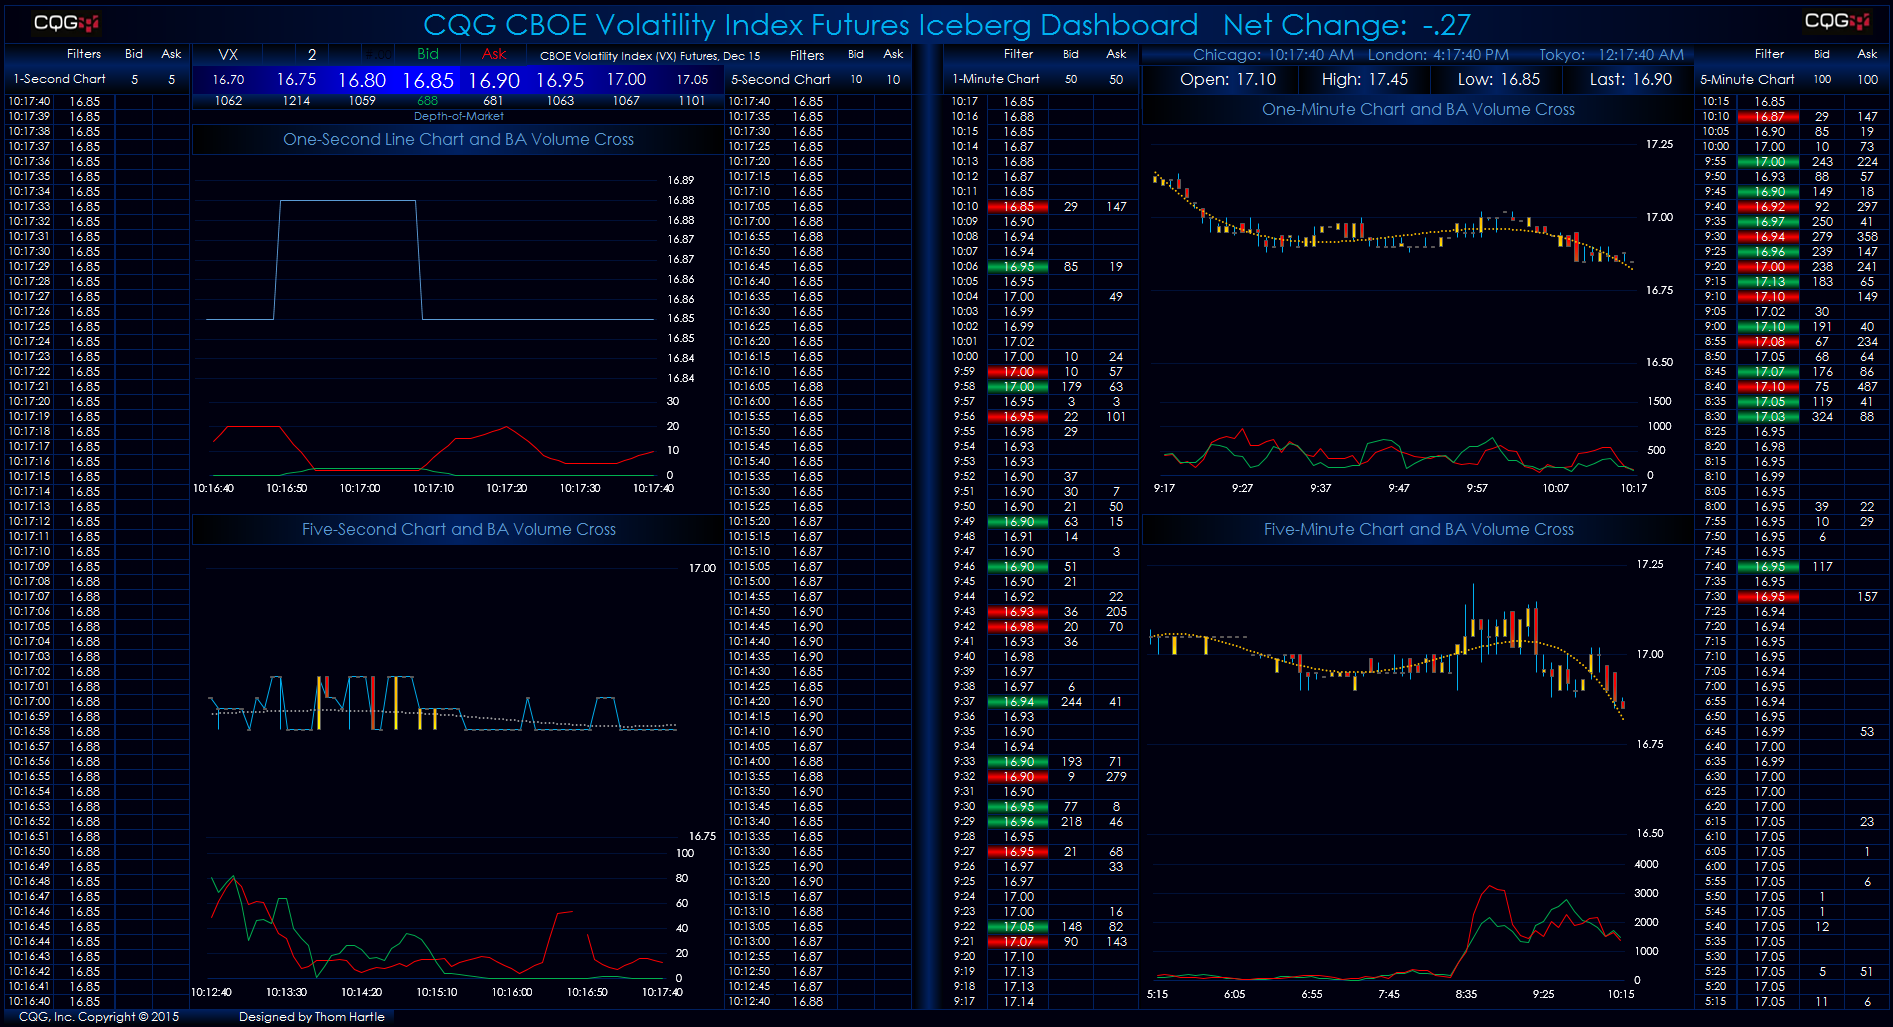
This Microsoft Excel® dashboard displays a depth-of-market (DOM) view of CBOE Volatility Index futures weekly reverse calendar spreads. The exchange quotes these markets as negative numbers for… more
Customers using our flagship product, CQG Integrated Client (CQG IC), have access to a new study called Algo Orders. Using a proprietary algorithm, this indicator of trading activity detects and… more

These Microsoft Excel® spreadsheets determine the at-the-money option and display a table of thirty strikes above and below the at-the-money. The tables consist of market data and the implied… more

If you use RTD formulas for data from the options markets, then Excel will pull data using your settings in CQG, such as the options model you have selected. An RTD formula for implied volatility… more
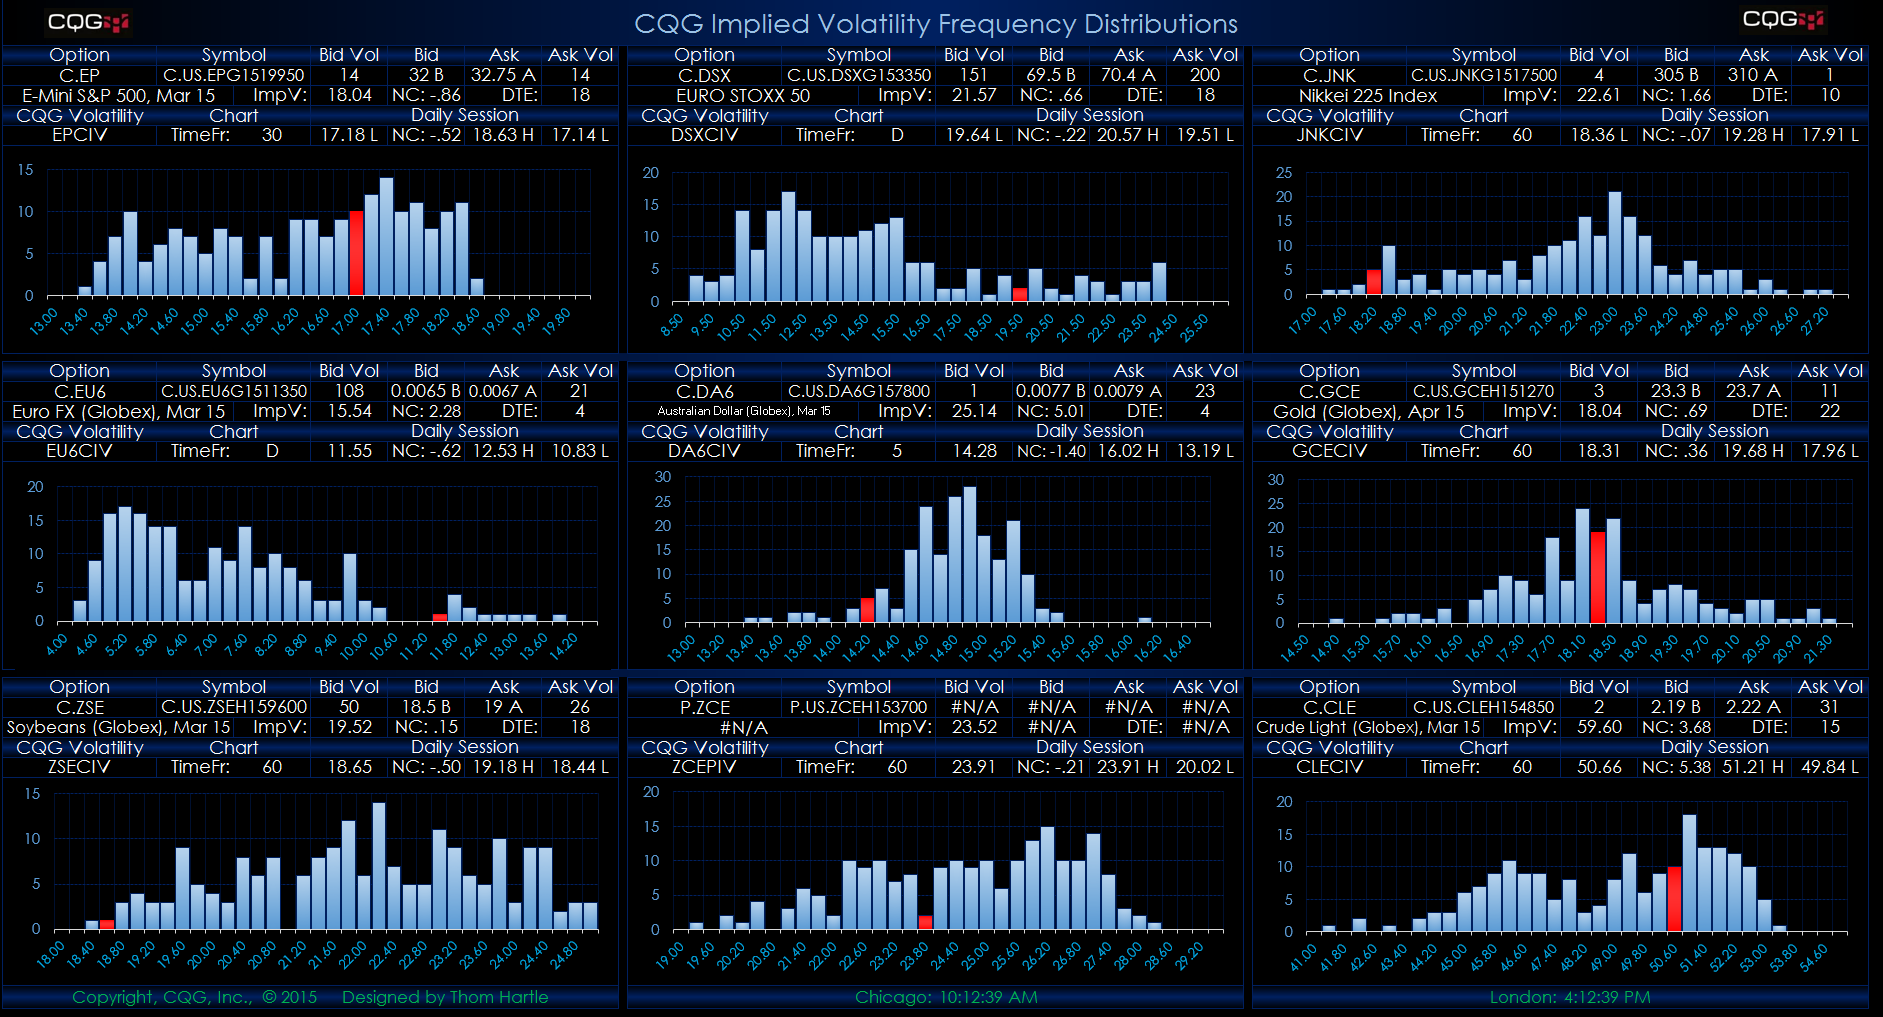
This Microsoft Excel® spreadsheet presents frequency distribution analysis of historical implied volatility (IV) data.
CQG offers its own historical options implied volatility index for… more

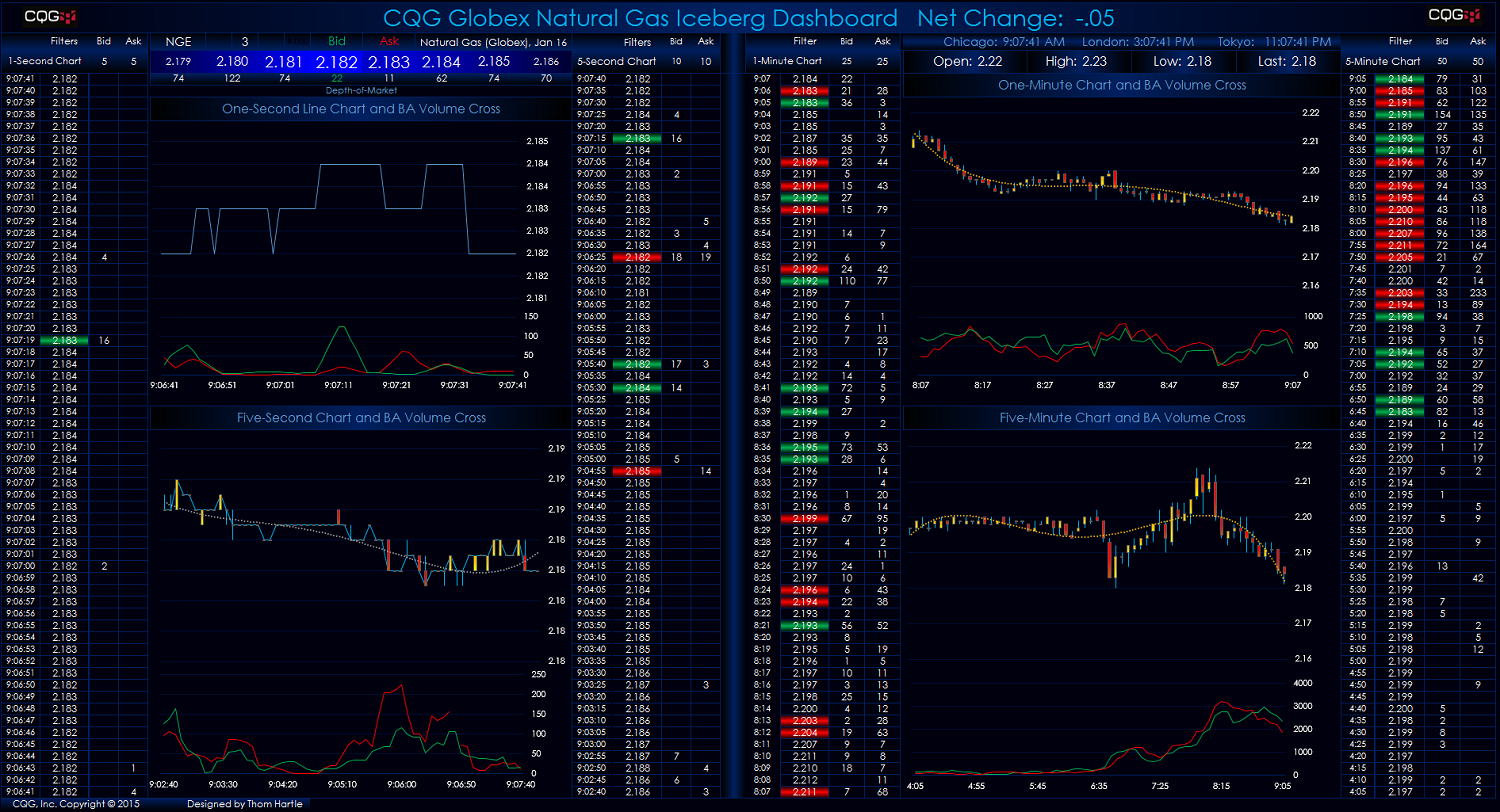
This Microsoft Excel® dashboard displays current market data and five-minute, fifteen-minute, thirty-minute, and sixty-minute measurements of volatility. Volatility is defined as the upper twenty-… more
Powered by CQG FX, this Microsoft Excel® dashboard measures volatility by using the difference between the upper and lower Bollinger Bands and dividing the difference by the Moving Average. The… more