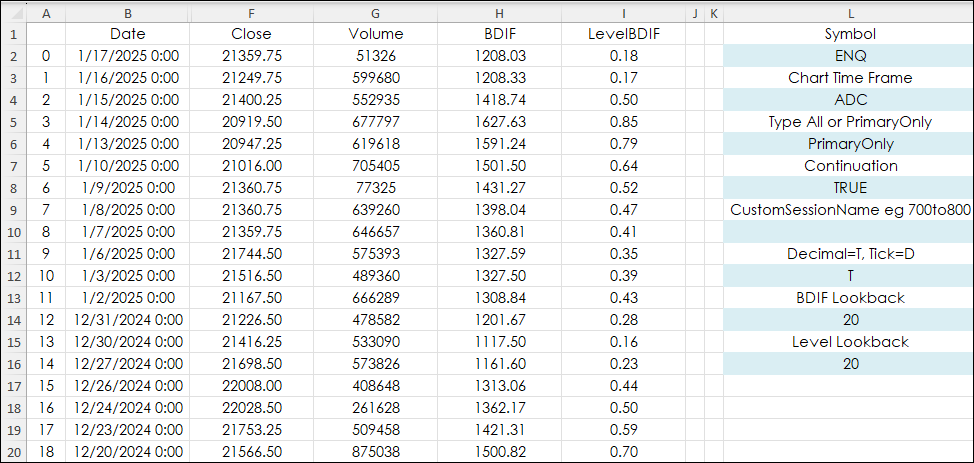
This post "CQG Primer: The Level Function" introduced the Level Function. The Level Function plots two lines, which identify the highest and lowest levels attained over a defined period. The… more
Workspaces
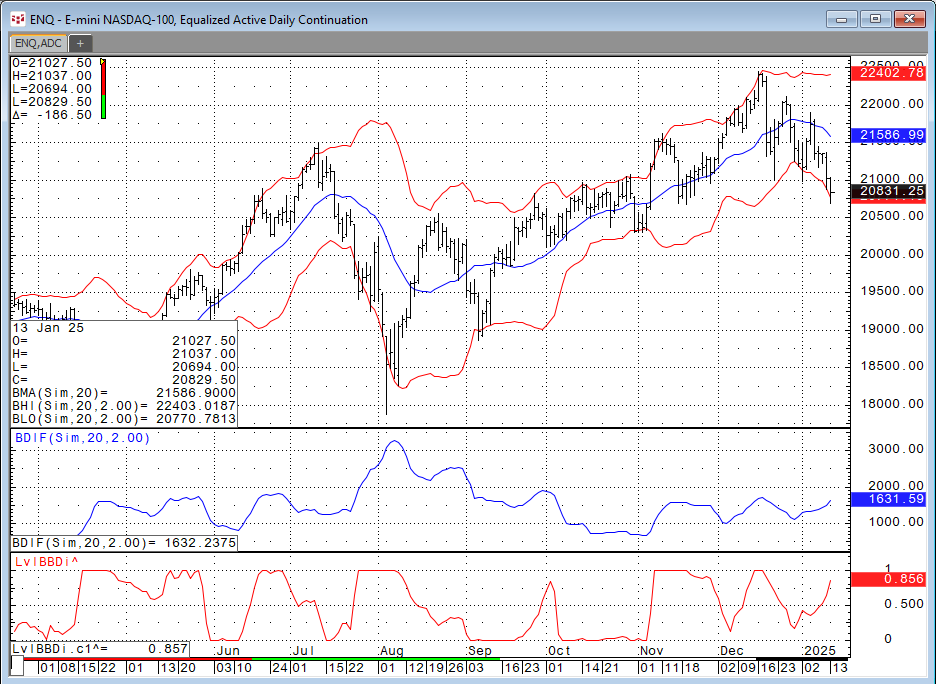
The Level Function plots two lines, which identify the highest and lowest levels attained over a defined period. The chart below displays the Level Function using the default lookback period of 20… more
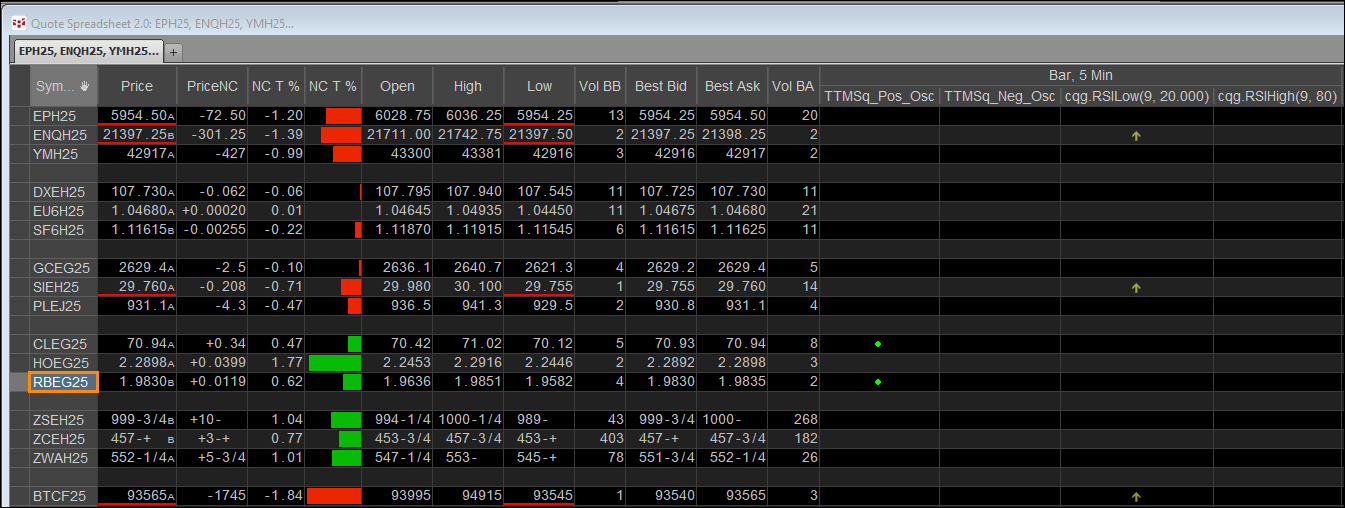
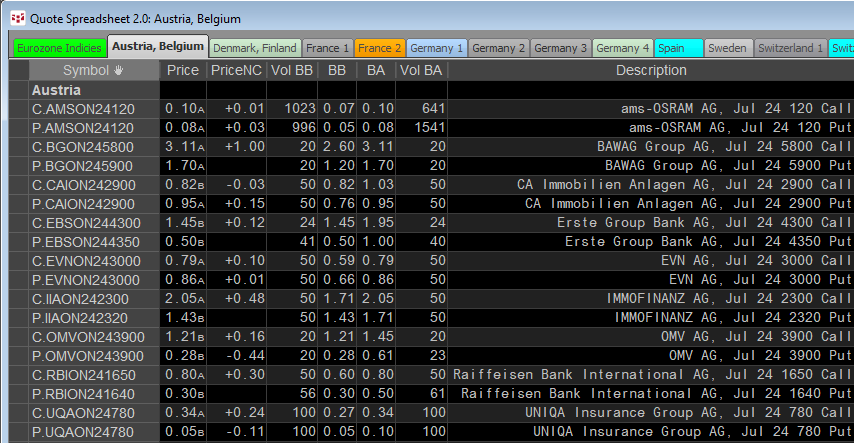
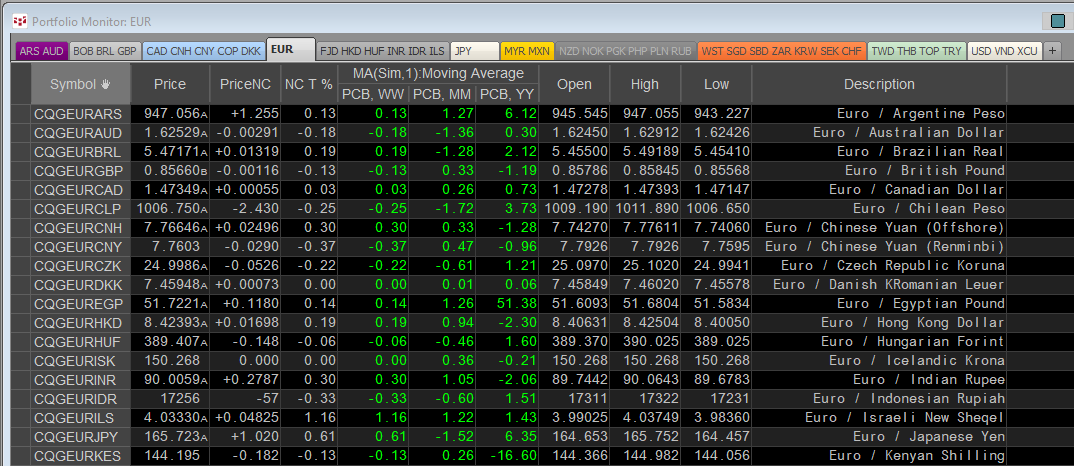
This post details using CQG's Quote Spreadsheet 2.0, Instrument Monitor, chart and DOMTrader to monitor and trade a portfolio of instruments on a single page.
The benefit of the Quote… more
Markets move through phases: An uptrend (higher highs preceded by higher lows), a downtrend (lower lows preceded by lower highs) and sideways or consolidation price action.
Technical based… more
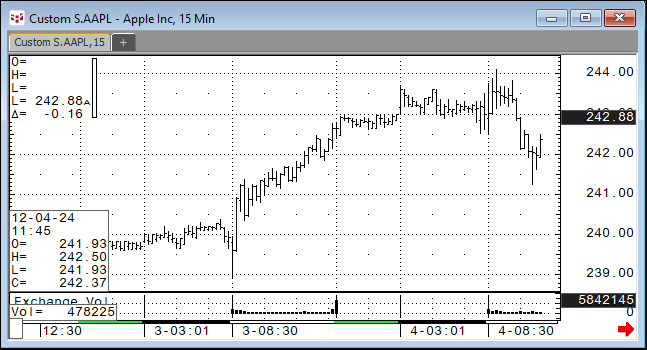
CQG IC and QTrader users can chart bid and ask orders activity for stocks during pre-market trading hours and after-market trading hours. This requires a custom session and setting the chart data… more
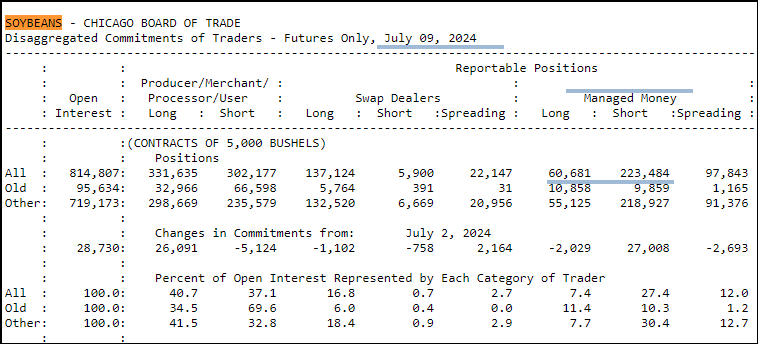
Tracking and analyzing cash market data is more difficult because most cash market data is a single print for the day of the report, that is there is no open, high, low or close, just the close.… more
Introduction
Cboe Europe Derivatives (CEDX) is a European derivatives marketplace which enables participants to access equity derivatives markets for quotes and trade execution.
CEDX offers a… more
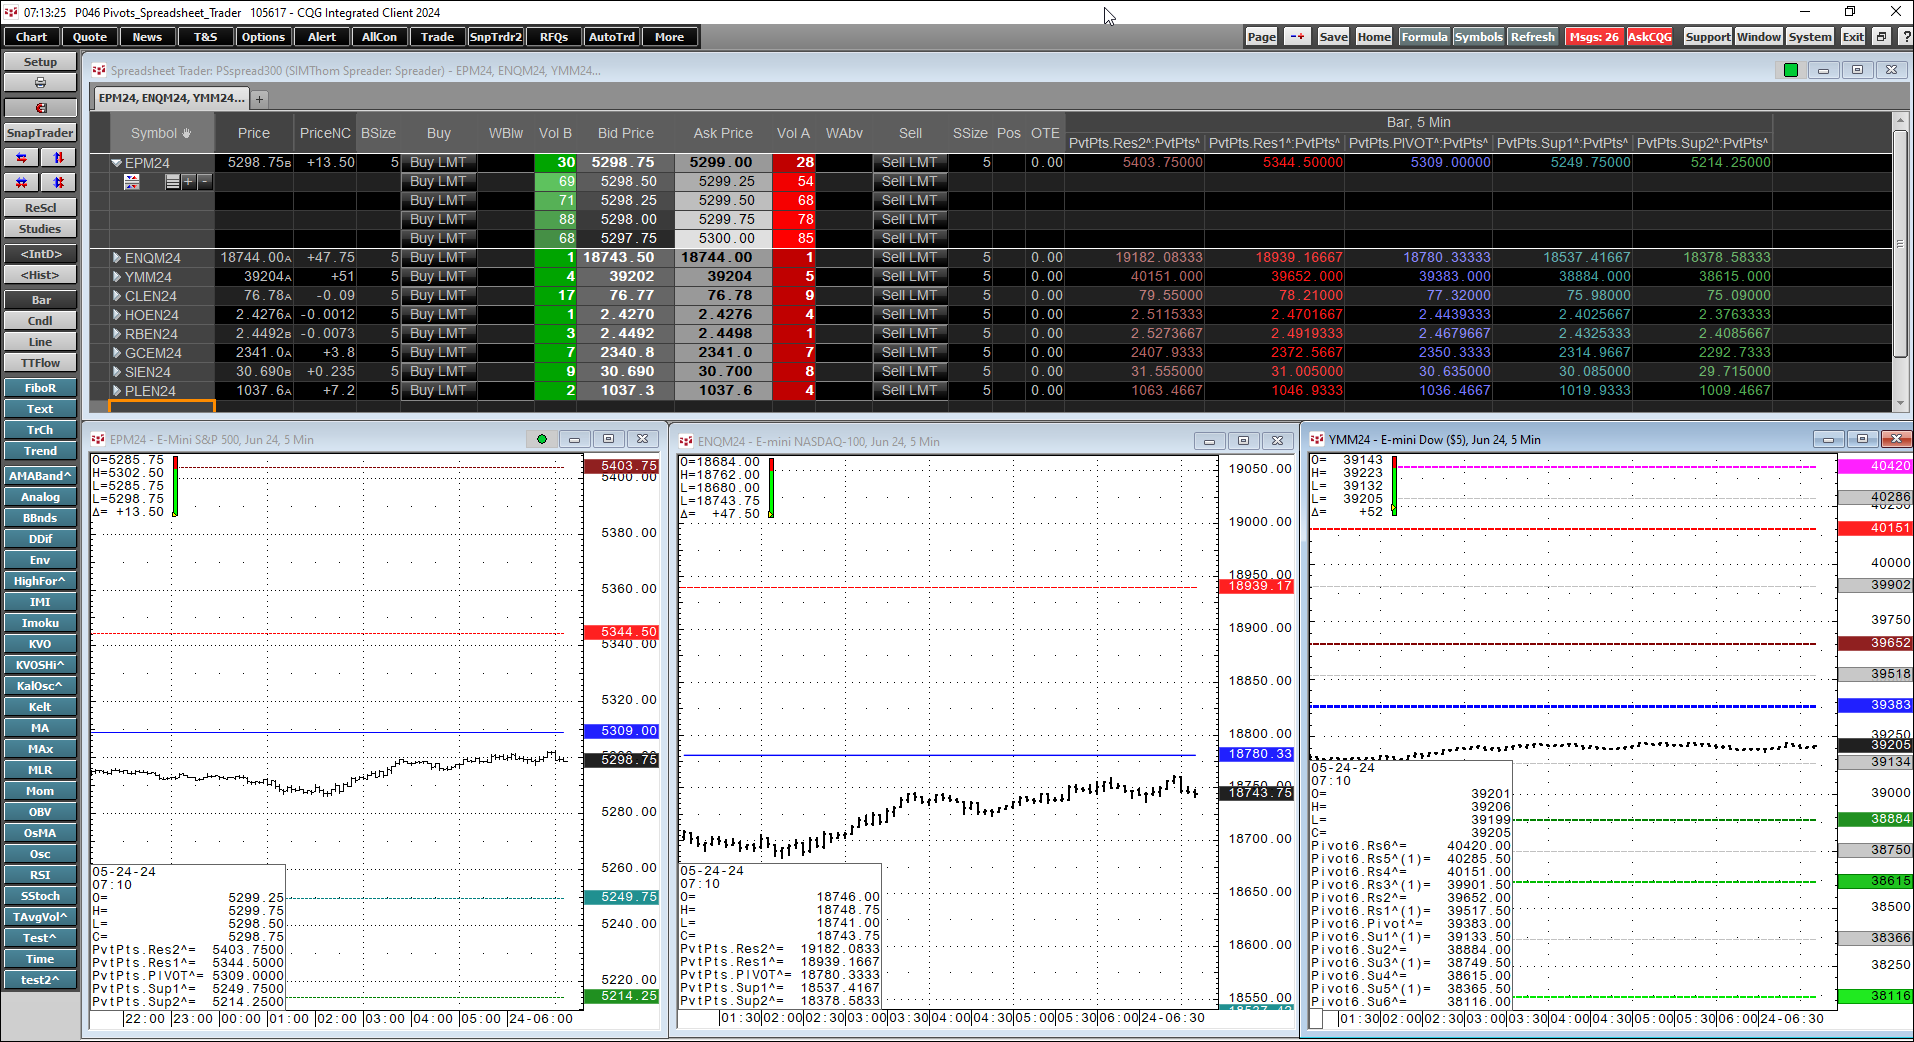
The pivot point is the arithmetic average of the high (H), low (L), and closing (C) prices of the active instrument, Pivot Point = (H+L+C)/3 or Pivot Point = HLC3. The study applied to a chart… more
CQG offers institutional pricing data across 430+ currency pairs of market data. Sourced directly from tier-1 banks and non-bank market makers worldwide, the feed provides up to 50 years of… more
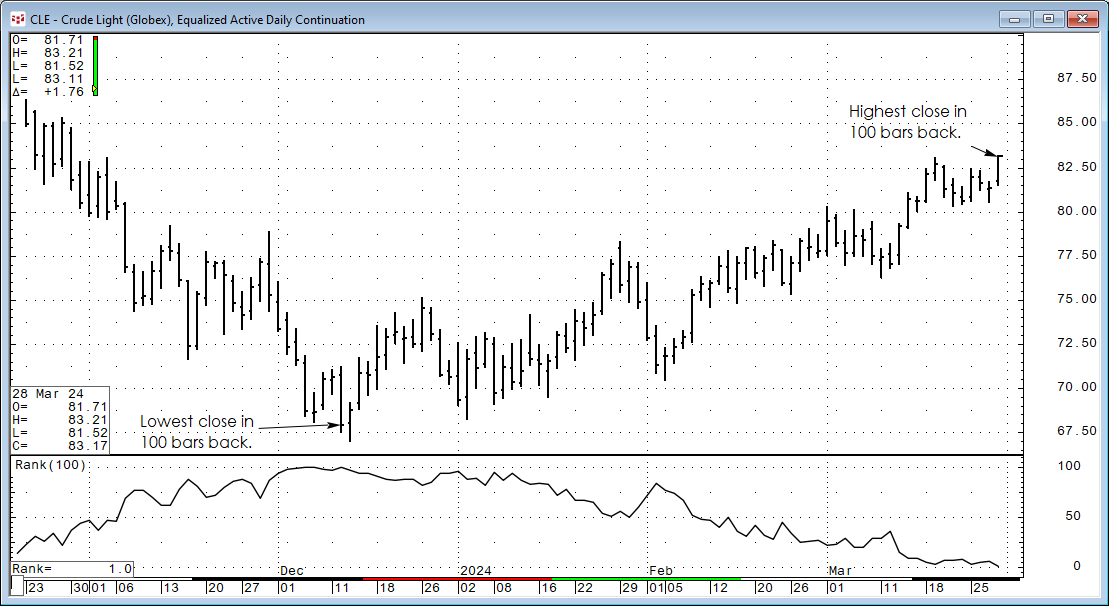
The CQG Rank Study ranks the individual chart points of a market over a specified number of previous trading periods. For example, if the current bar's close had a rank of 3, and the periods were… more