This post details the use of the CQG function: Time Average (TimeAvg), which calculates the average for values taken at the same time of day over the lookback period.
In this example, the average values calculated is the average “traded volume” using the same bar by session time over the last twenty sessions. The advantage is the analyst/trader can identify unusual volume levels relative to average traded volume values based on the same time bar in the lookback period.
This study was developed by CQG Product Specialist Jim Stavros.
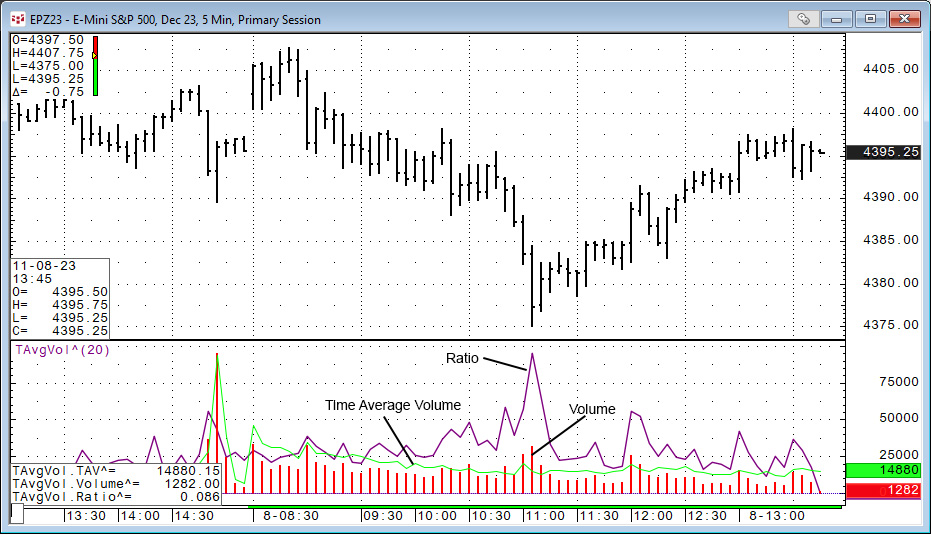
The PAC available at the bottom of the post will install the TAvgVol study. The study displays three curves. The green line is the Time Average Volume line, which is the average of the previous 20 volume values for the same time bars. The red line is volume for each bar. The dark blue line is the ratio of the volume to the Time Average Volume line. In the above example the volume surged to more than twice the average volume.
The current Time Average Volume line value does not use the current volume in order to provide a fixed frame of reference. The study has a parameter to set the number of bars to average (days).
At the bottom of the post is an Excel spreadsheet for CQG customers who want to pull the data into Excel. The PAC must be installed.

Requires CQG Integrated Client or CQG QTrader and Excel 2010 or more recent.