This post details a custom CQG study for pulling a market’s all time high price and date and the market’s all time low price and date.
The custom study was built by CQG’s Product Specialist Jim Stavros and is available as a downloadable CQG PAC at the bottom of this post.
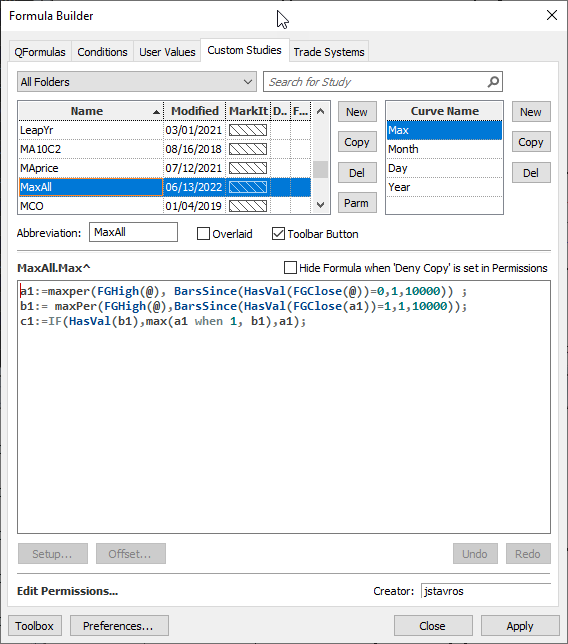
The MaxAll Study PAC has four curves.
- Max: The highest price
- Month: The month the highest price occurred in
- Day: The day of the month the highest price occurred in
- Year: The year of the highest price occurred in
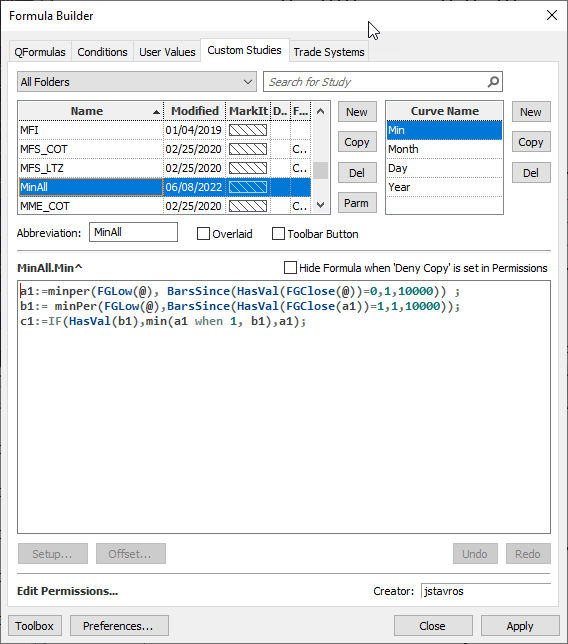
The CQG Pac includes the MinAll study and determines the same data information except this is for the price and date of the lowest price. The studies are applied to Active Daily Continuation charts.
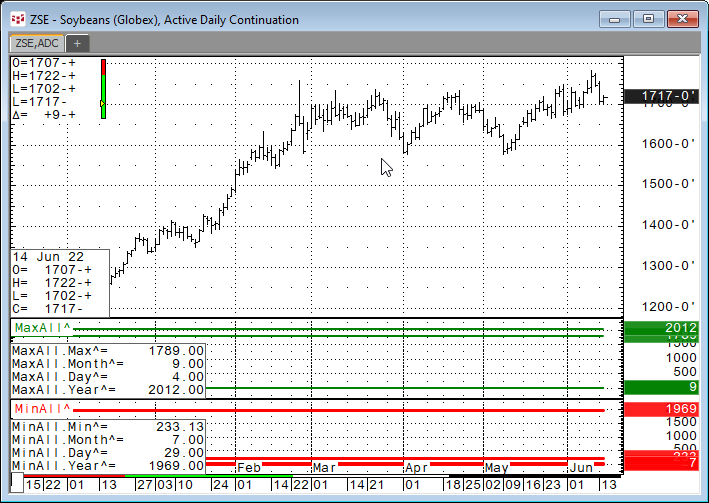
When the studies are applied to a chart then the study cursor window displays the data. Here, the highest price for Soybeans was $1789.00 on 9/4/2012 and the lowest price was $233.13 on 7/29/1969
This same data can be pulled into an Excel Dashboard using RTD formulas. This allows you to build a display of multiple markets’ highest prices and dates and lowest prices and dates.
The symbol is in cell A2, the chart time frame (ADC) is in cell M2. The RTD formula for the highest price is:
=RTD("cqg.rtd",,"StudyData",$A2,"MaxAll^",,"Max",$M$2,0,"all",,,,"T")
The RTD formulas for the month, day and year are:
= RTD("cqg.rtd",,"StudyData",$A2,"MaxAll^",,"Month",$M$2,0,"all",,,,"T") = RTD("cqg.rtd",,"StudyData",$A2,"MaxAll^",,"Day",$M$2,0,"all",,,,"T") = RTD("cqg.rtd",,"StudyData",$A2,"MaxAll^",,"Year",$M$2,0,"all",,,,"T")
We can combine all three RTD formulas into one cell including concatenating the slash between each RTD formula (9/4/2012):
=RTD("cqg.rtd",,"StudyData",$A2,"MaxAll^",,"Month",$M$2,0,"all",,,,"T")&"/"&RTD("cqg.rtd",,"StudyData",$A2,"MaxAll^",,"Day",$M$2,0,"all",,,,"T")&"/"&RTD("cqg.rtd",,"StudyData",$A2,"MaxAll^",,"Year",$M$2,0,"all",,,,"T")To pull in the lowest price and date use:
=RTD("cqg.rtd",,"StudyData",$A2,"MinAll^",,"Min",$M$2,0,"all",,,,"T") = RTD("cqg.rtd",,"StudyData",$A2,"MinAll^",,"Month",$M$2,0,"all",,,,"T") = RTD("cqg.rtd",,"StudyData",$A2,"MinAll^",,"Day",$M$2,0,"all",,,,"T") = RTD("cqg.rtd",,"StudyData",$A2,"MinAll^",,"Year",$M$2,0,"all",,,,"T")
Or for the combined date:
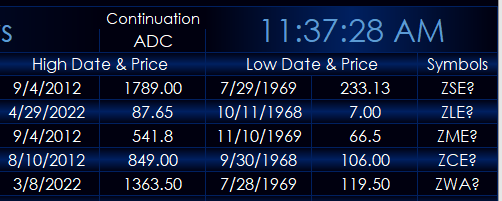
=RTD("cqg.rtd",,"StudyData",$A2,"MinAll^",,"Month",$M$2,0,"all",,,,"T")&"/"&RTD("cqg.rtd",,"StudyData",$A2,"MinAll^",,"Day",$M$2,0,"all",,,,"T")&"/"&RTD("cqg.rtd",,"StudyData",$A2,"MinAll^",,"Year",$M$2,0,"all",,,,"T")The downloadable Excel Quote dashboard includes the date and price of the highest price and the date and price of the lowest price using the symbols entered into the first column in the spreadsheet. The symbols are displayed in the final column to the right as a reference.
In addition, the Excel Quote Dashboard includes RTD formulas for Description, Last Price, Net Change, Yesterday’s Settlement, Open, High and Low, There are macro buttons to hide or show the Excel ribbon.
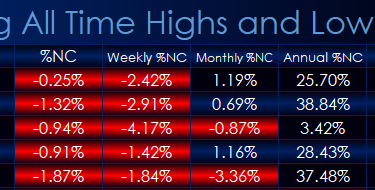
There is a section to display today’s percent net change, the weekly percent net change, the monthly percent net change, and the percent net change for the year.
This spreadsheet is pulling a large amount of historical data from CQG and may take a few minutes to fully populate.
Requires CQG Integrated Client or CQG QTrader , and Excel 2010 or higher. Excel has to be installed on the local computer, not in the cloud.
