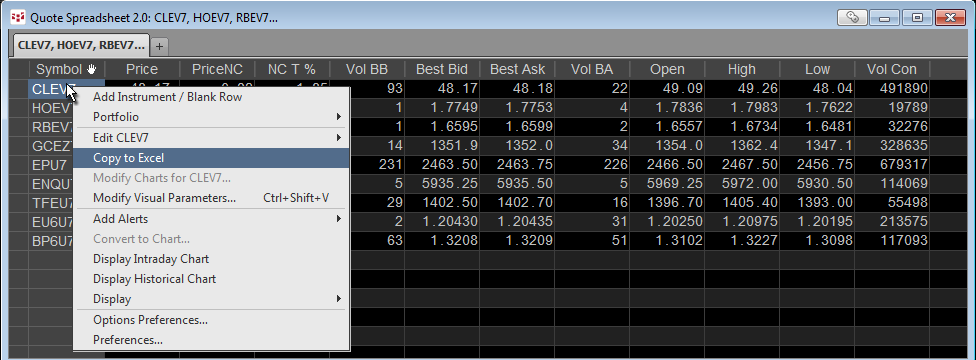
Customers who use Microsoft Excel® when following the markets can easily populate their Excel spreadsheet with RTD formulas using CQG's Quote SpreadSheet (QSS) 2.0.
To open QSS 2.0, click… more
Customers who use Microsoft Excel® when following the markets can easily populate their Excel spreadsheet with RTD formulas using CQG's Quote SpreadSheet (QSS) 2.0.
To open QSS 2.0, click… more
Welcome to CQG. Here is some important information to get you started. If you need help logging on, review these steps.
Main WindowOnce you have logged on, you see the main window.
… more
In this article, we outline how to pull historical market data into Excel while excluding data from days when the market was in a holiday session.
Holiday sessions are trading dates, but… more
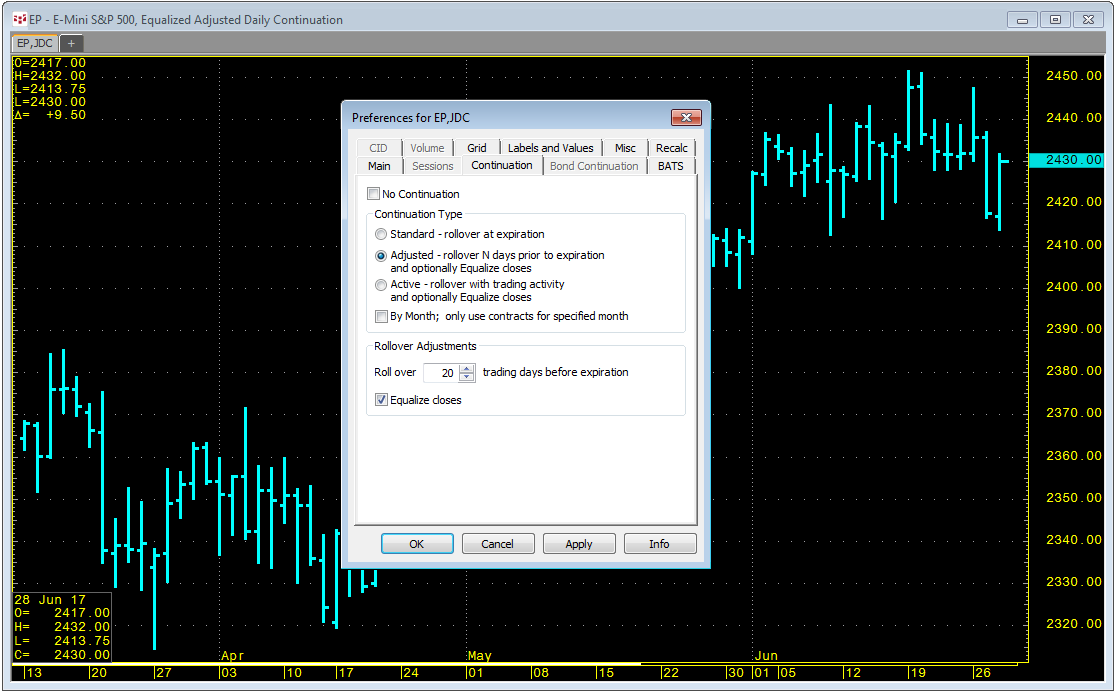
RTD formulas for chart types and studies can include the same parameter settings used in your CQG continuation charts. In the RTD formula the continuation parameters are entered in the “time… more
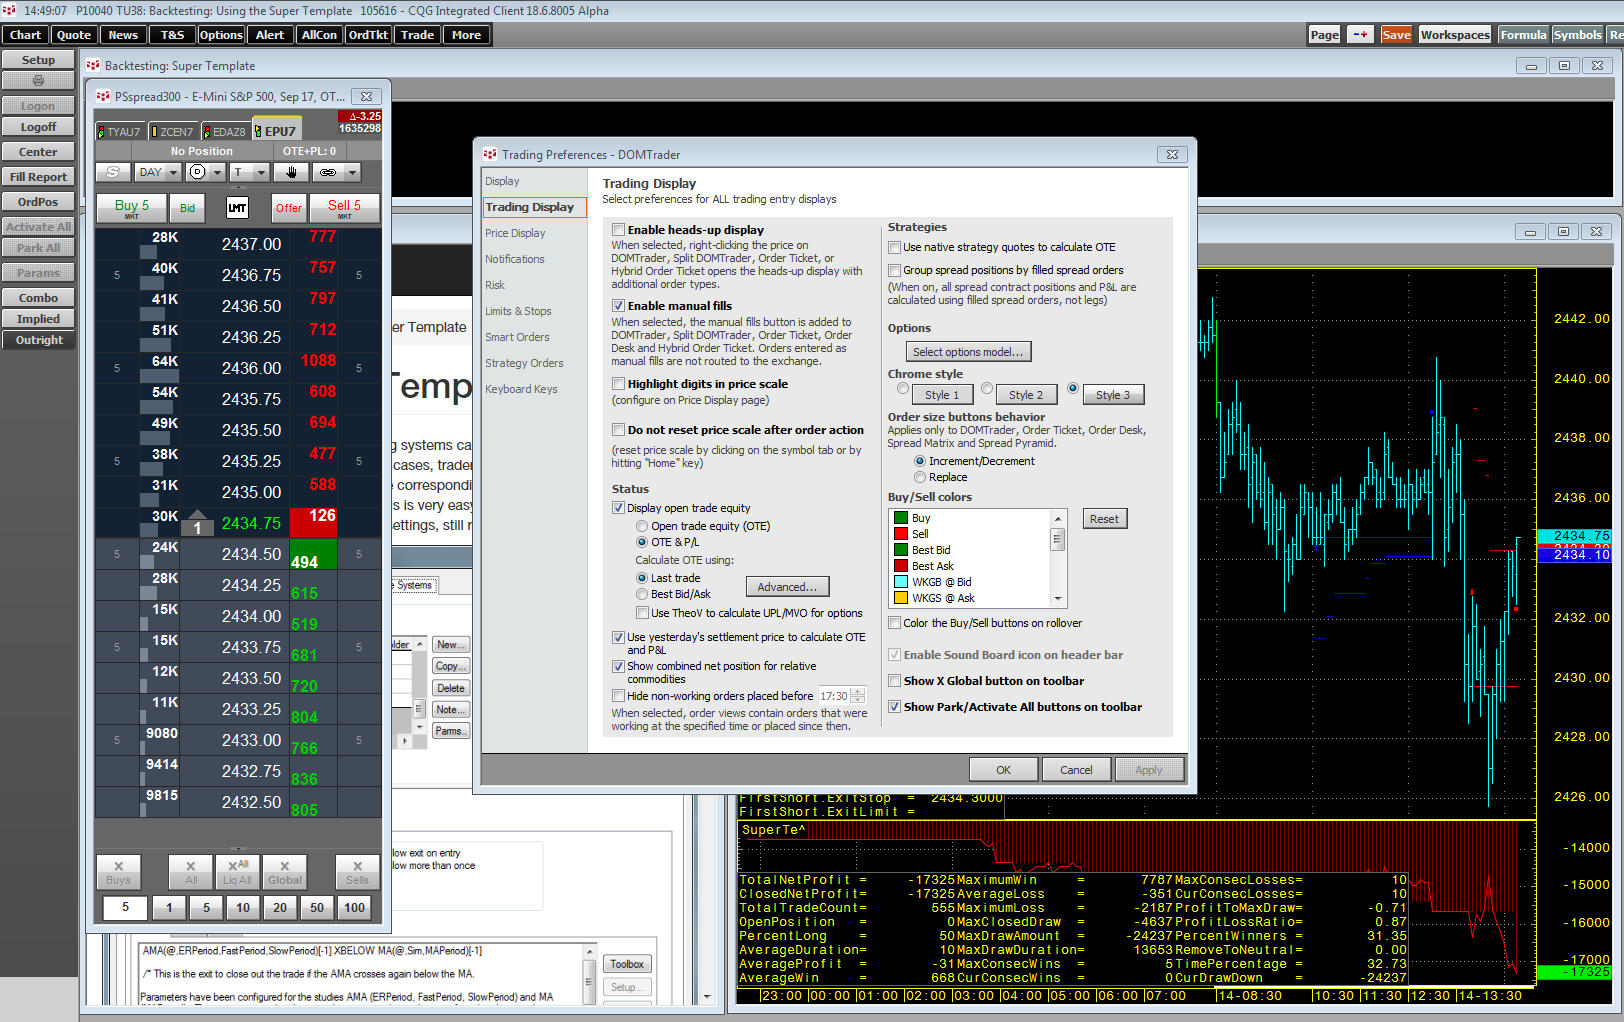
Some traders want to see their current open trade equity (OTE) and closed out trades (P&L) based on yesterday’s settlement, not the original price when the trade was opened. In DOMTrader's… more
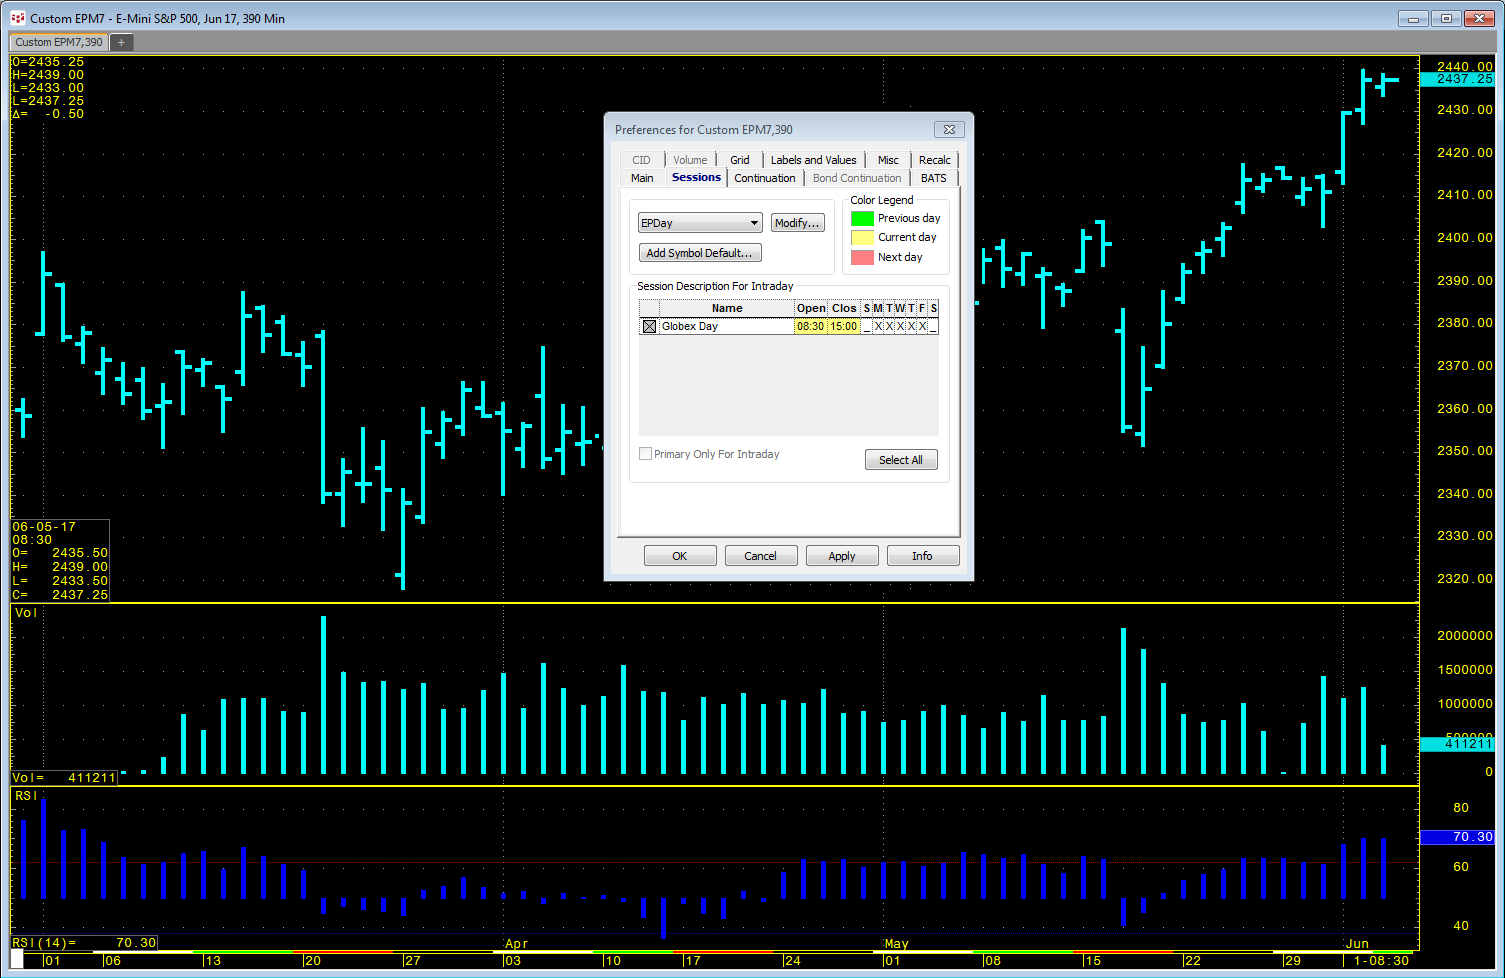
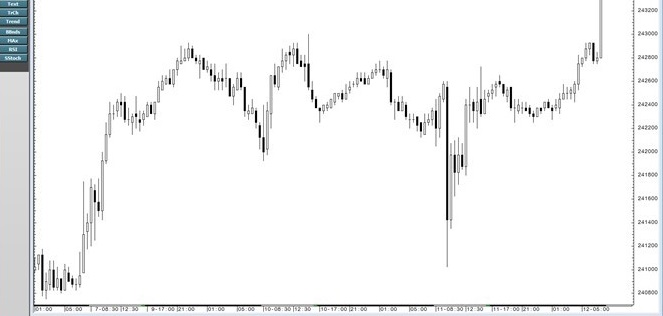
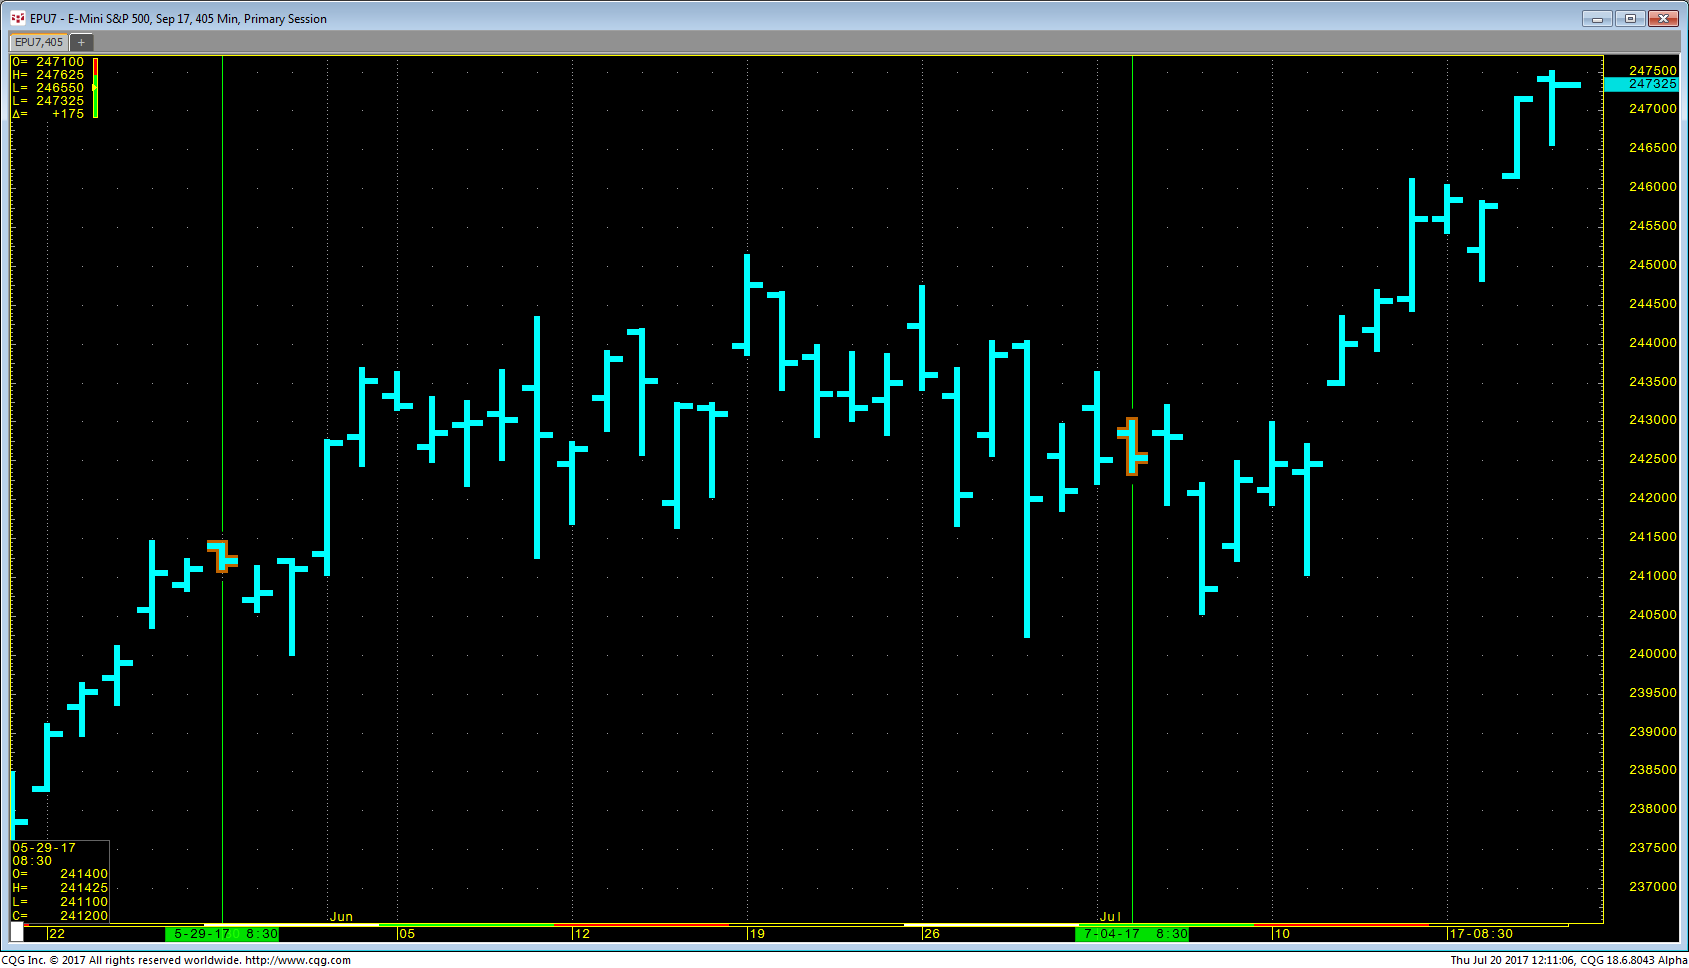
CQG Integrated Client customers can set up custom sessions for their charts. For example, NYSE’s trading hours are from 8:30 to 15:00. The primary session for the E-mini S&P opens at 8:30, but… more
CQG customers who create their own custom studies can easily use RTD to pull custom study values into Excel.
There are only two unique requirements in the RTD formula for a custom study:… more
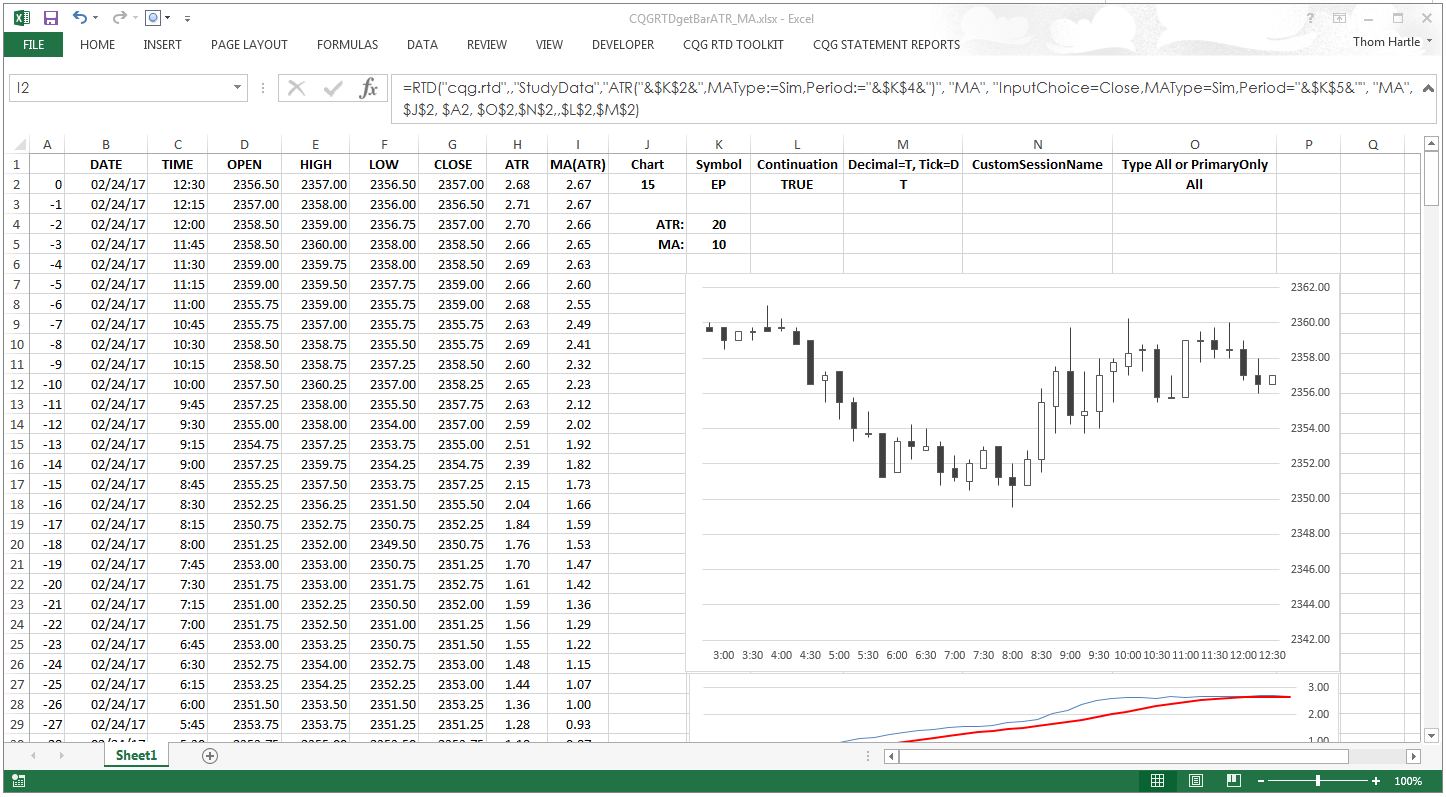
This article shows RTD formulas for pulling values into Microsoft Excel® that are a study applied to a study.
A common use of Excel with CQG is to pull in study data, such as the… more
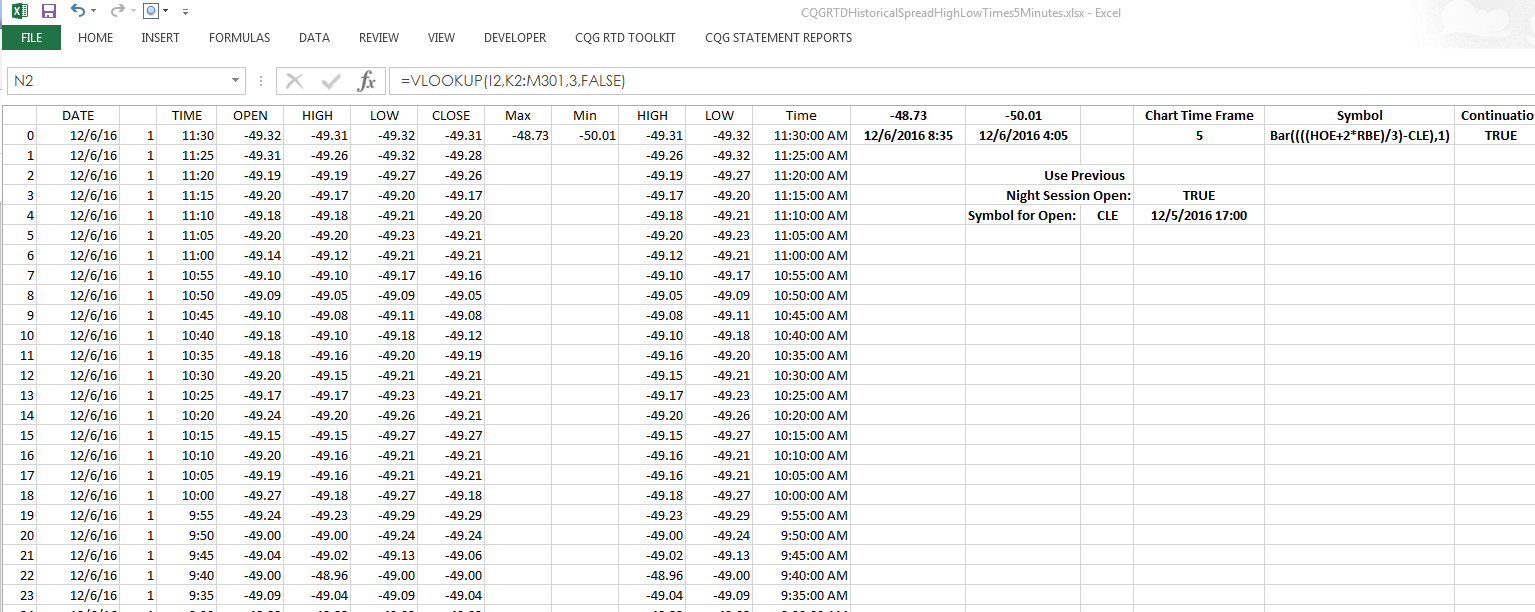
CQG Integrated Client and CQG QTrader customers can pull the time the high and low occurred during today’s session into a Microsoft Excel® spreadsheet using these RTD formulas:… more
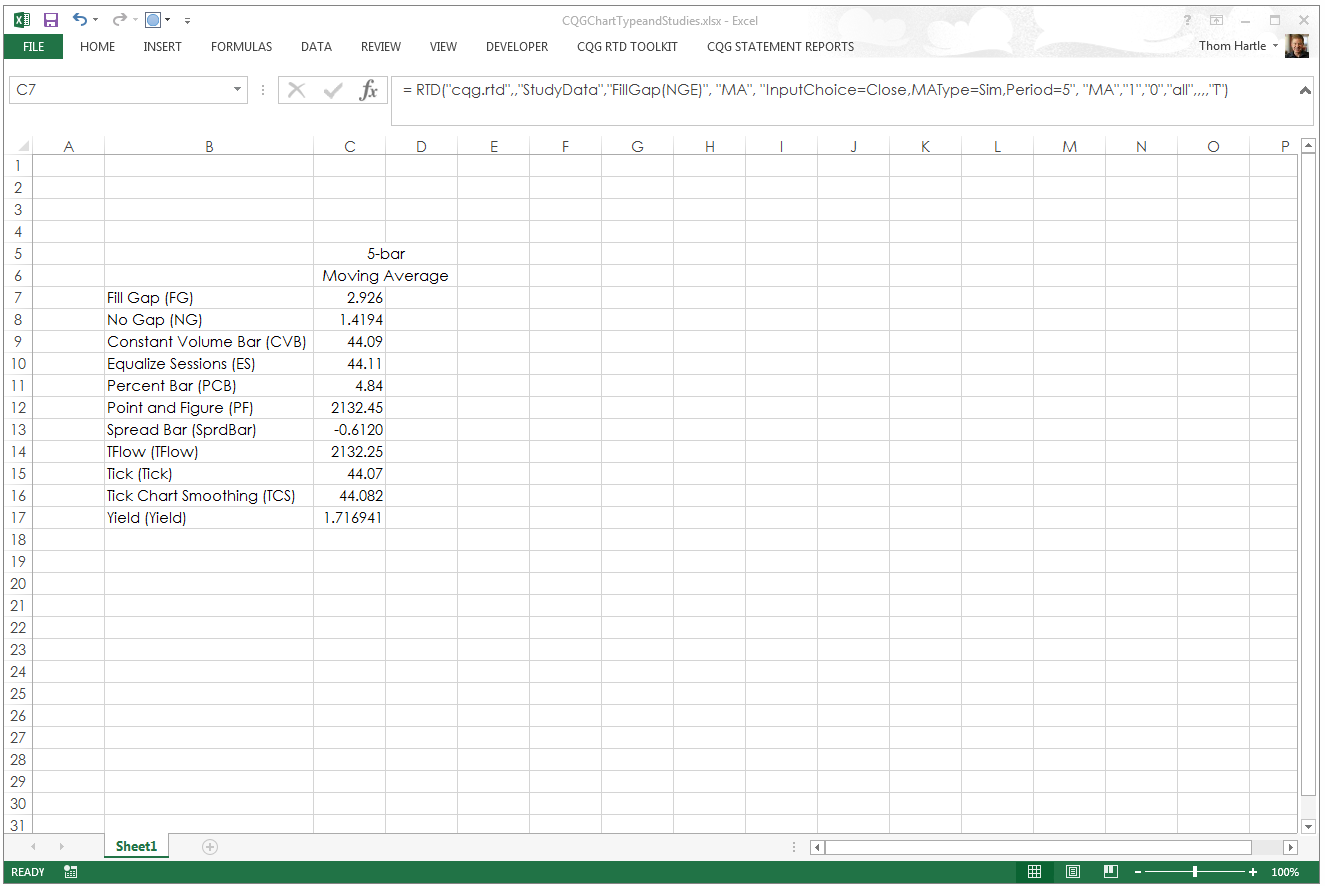
The Microsoft Excel® RTD Studies sample offers a collection of RTD CQG study formulas applied to the Bar chart type. If you want to use other chart types, such as no gap or constant volume… more