Four new chart types have been added to CQG. This article details the RTD formulas for calling market and study data into Excel using these new chart types. The chart types are:
These four chart types use a symbol format for the chart type and the chart parameters.
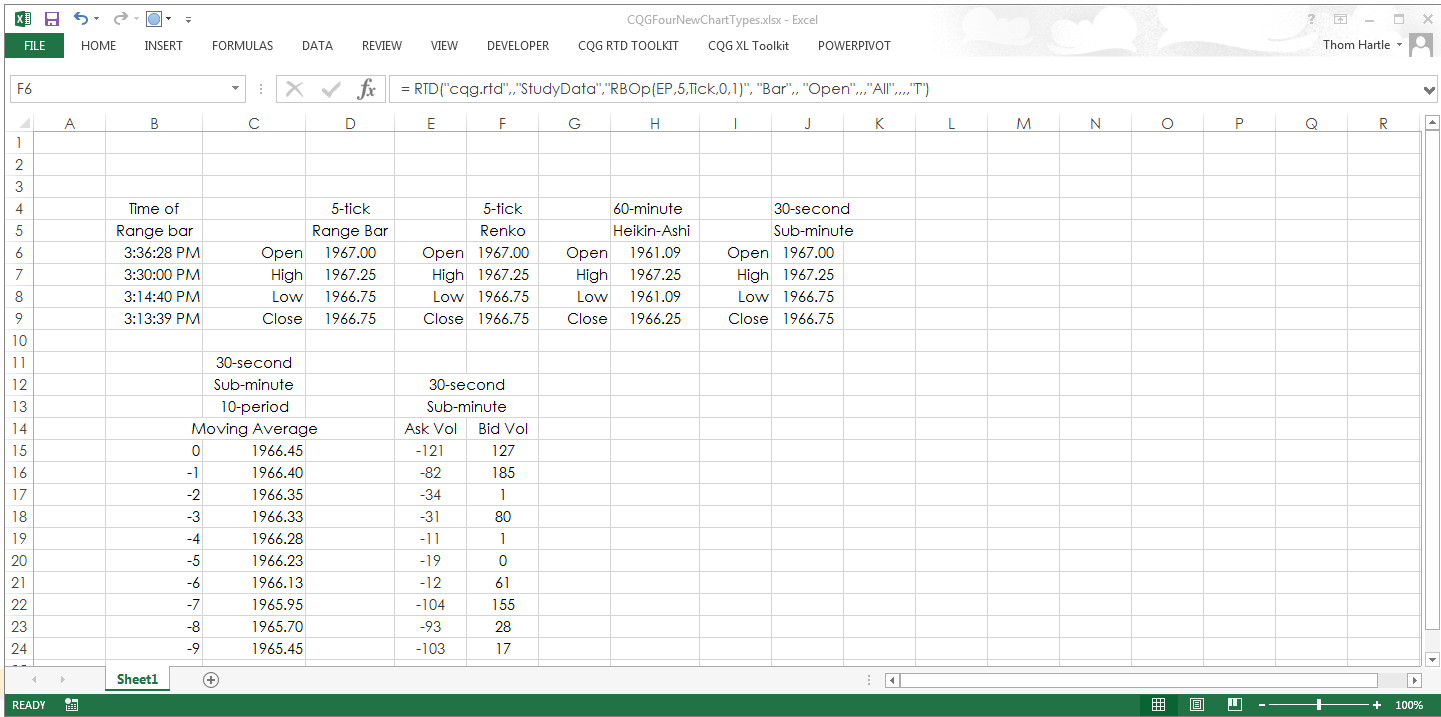
Following are examples for these chart types.
Heikin-Ashi Candlestick Chart
To pull in market or study data for an E-mini S&P Heikin-Ashi candlestick chart, use (HAOp(EP,0)) for the symbol. Here is the formula for the open for a 60-minute E-mini S&P Heikin-Ashi candlestick chart:
= RTD("cqg.rtd",,"StudyData","HAOp(EP,0)", "Bar",, "Open","60","0","All",,,,"T")The 0 within HAOp(EP,0) indicates a regular candlestick chart. If you want to use a Fill Gap candlestick chart, then replace the 0 with 1. You can pull historical data by replacing the 0 next to the time frame, here 60 minutes, with -1, -2, etc.
Range Bar and Renko Charts
These two chart types use almost the same symbol format: Range Bar is RBOp(EP,5,Tick,0,0) and Renko is RBOpRenko(EP,5,Tick,0,1). To pull a 10-period simple moving average for a 5-tick Range Bar chart:
= RTD("cqg.rtd",,"StudyData","RBOp(EP,5,Tick,0,0)", "MA", "InputChoice=Close,MAType=Sim,Period=10", "MA",,,"all",,,,"T")Notice that the RTD formula does not have a time frame declaration. That is because these two chart types build bars based on price movement, here five ticks, not time. You can replace Tick with Price in the symbol, i.e., RBOp(EP,125,Price,0,0). You have to use a tick increment. The E-mini S&P has a minimum price increment of 0.25. For 5 ticks you would use 125. The first 0 in the symbol is for dealing with price gaps, also referred to as null bars. This setting will compress price movement with no traded volume into a single bar. For more details, please see the help file.
Sub-Minute Chart
For sub-minute charts, the symbol is: SUBMINUTE(EP,30,Regular). Here, the time frame is 30 seconds. Use these formulas to see the traded volume at the ask price and the bid price:
= RTD("cqg.rtd",,"StudyData","VolAsk(SUBMINUTE(EP,30,Regular))", "Bar",, "Close",,"0","All",,,,"T")

= RTD("cqg.rtd",,"StudyData","VolBid(SUBMINUTE(EP,30,Regular))", "Bar",, "Close",,"0","All",,,,"T")
Regular bars are selected. You can also get Fill Gap bars (use FillGap) and No Gap bars (use NoGap).
Download the sample spreadsheet for more examples.
Make sure to lower your Excel RealTimeData (RTD) throttle to 50 milliseconds. Learn how to do that here.
Requires CQG IC or CQG QTrader.