This Microsoft Excel® dashboard tracks the 506 stocks in the S&P 500 index using CQG’s Level function. The Level function plots two lines, which identify the highest and lowest price levels… more
Workspaces
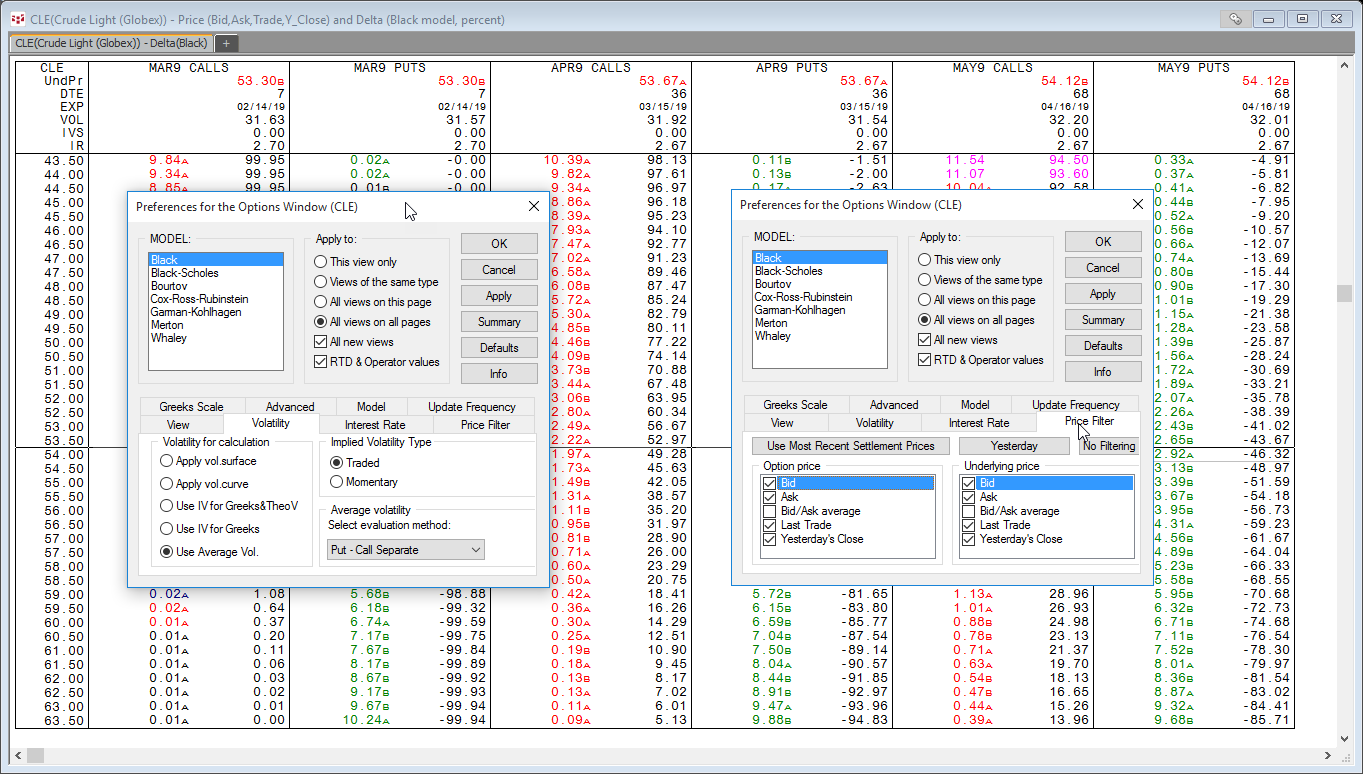
If you set up a Microsoft Excel® dashboard to monitor options prices and their respective deltas you may see the delta values disappear occasionally in the dashboard. In other words, the value for… more
This Microsoft Excel® dashboard tracks the 104 stocks in the Nasdaq-100 index using CQG’s Level function. The Level function plots two lines, which identify the highest and lowest price levels… more
After the current trading session ends, many exchanges clear out today’s market data to set up for the preopening posting of orders to the exchange's order book. This includes today’s open, high,… more
This Microsoft Excel® spreadsheet pulls in live cattle, feeder cattle, and lean hogs market data traded on CME Globex.
The forward curves display today's data. If the last price is… more
Updated July 24, 2025
Bring Updating Time-Series Data from Microsoft Excel® Into CQGThe XL Real-Time study is included in CQGIC subscriptions enabled for CQG Trading, or Spreader, as well as… more
This Microsoft Excel® dashboard presents two charts of the Nasdaq-100 futures contract and market data for the one hundred stocks that are constituents of the Nasdaq 100 Index.
… moreYou can easily hide things unnecessary items in Microsoft Excel® to open up more screen real estate. All of my published CQG-powered Excel dashboards show you an image. You may have also noticed… more
This is an updated post detailing new features in the original dashboards from a previous post. The three downloadable Microsoft Excel® dashboards present a unique view of four markets. Each… more
This Microsoft Excel® spreadsheet pulls in market data for NFX WTI Crude Oil Penultimate Financial (symbol: NTQ) and NFX Brent Crude (symbol: BFQ), both traded on the NASDAQ OMX Futures Exchange (… more

