
On August 24, 2026, the Chicago Mercantile Exchange began trading E-nano Equity Index futures contracts. The new contracts give 23-hour exposure to the S&P 500, Nasdaq-100, Russell 2000 and… more
Workspaces
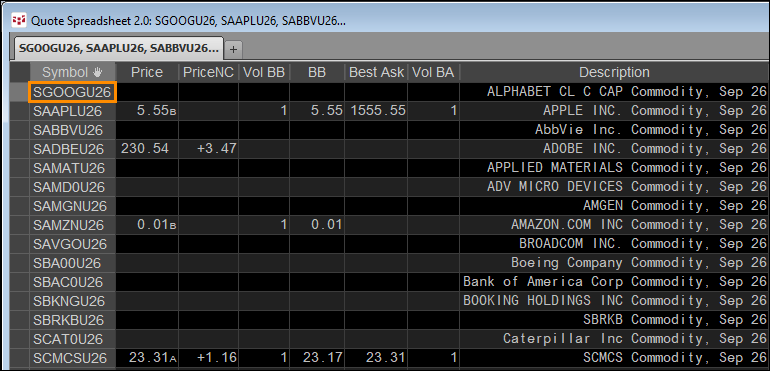
The CME is now offering Single Stock Futures trading. The benefits include:
Around-the-clock trading access. Futures trade nearly 24 hours a day (17:00 CST to 16:00 CST) allowing you to trade… more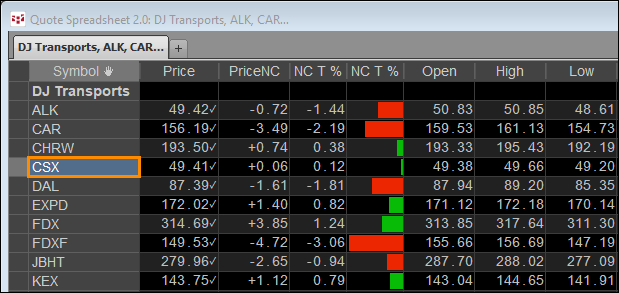
This post offers a downloadable CQG PAC for installing the DJT and DJU Page in CQG IC or QTrader. The page details the current session's market performance of the constituents of the two averages… more
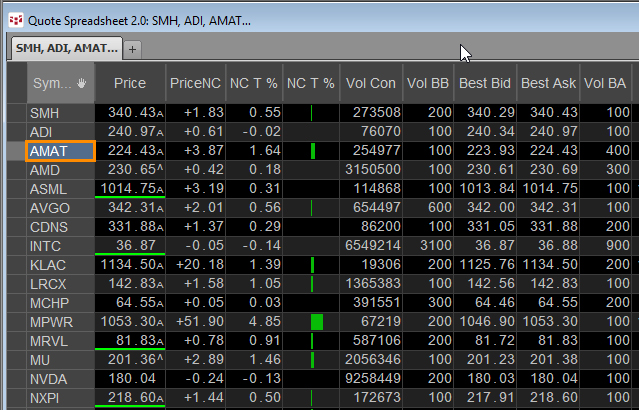
This post "Top Ten Performing ETFs for the Last Ten Years" listed the top performing ETFs since January 2015.
The top performer was VanEck Semiconductor ETF, symbol: SMH.
The VanEck… more
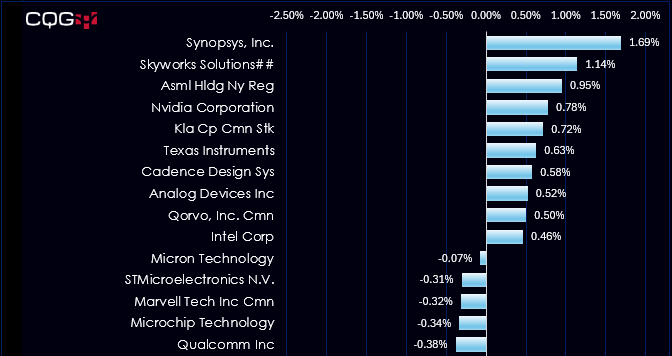
This post "Top Ten Performing ETFs for the Last Ten Years" listed the top performing ETFs since January 2015.
The top performer was VanEck Semiconductor ETF, symbol: SMH.
The VanEck… more
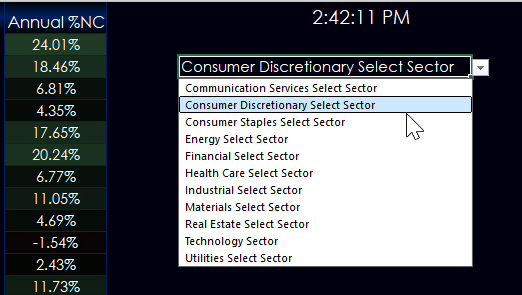
This post builds upon the previous post: Excel 365 TRIMRANGE Function.
That post detailed how to build a quote display using the TRIMRANGE function to automatically manage working with… more
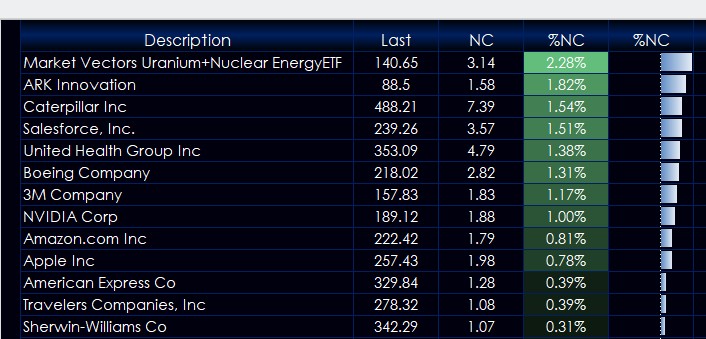
Microsoft Excel 365 offers the TRIMRANGE function which excludes all empty rows and/or columns from the outer edges of a range or array. This post details how this function is useful for designing… more
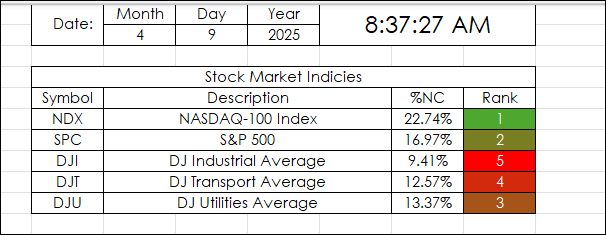
This Excel Dashboard uses RTD Calls to pull in the Net Percent Change of a collection of markets by a particular date.
For example, April 9, 2025:
"Markets News, April 9, 2025: Dow… more
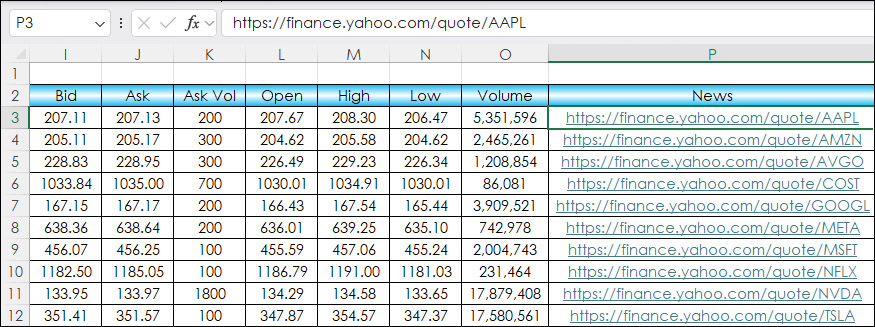
This post details adding HTML News Links to an Excel dashboard for monitoring equities and ETFs.
The news source is Finance.Yahoo.com. An example link for Microsoft is https://finance.yahoo.… more
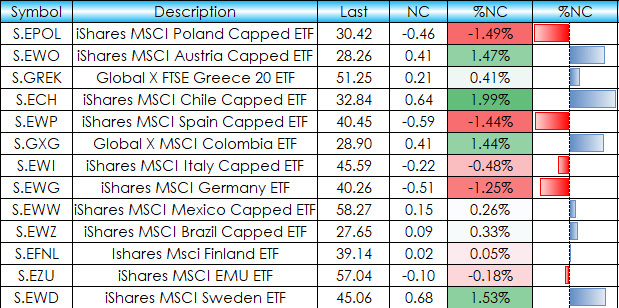
This post details an Excel dashboard tracking Country Equity ETFs performance. The dashboard ranks and sorts the Country ETFs traded using the NYSE American enablement. Fifty-one ETFs are tracked… more