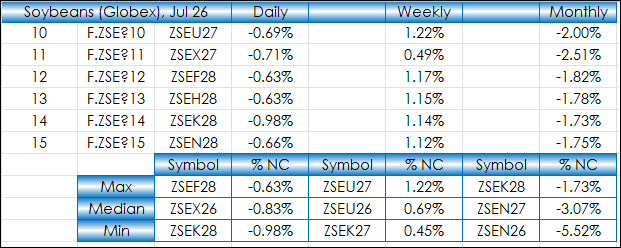
This post walks through using Excel's XLOOKUP with Min, Median, and Max Functions to create a summary table of market performance for the forward curves of Soybeans, Soybean Meal, Soybean Oil,… more
Workspaces
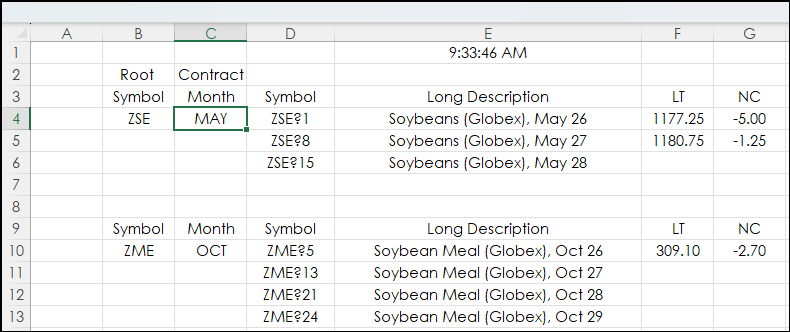
This post builds upon the post: Excel Agriculture Dashboard Using the FILTER Function.
The original post built market quote display blocks using a data tab with specific row ranges employed… more
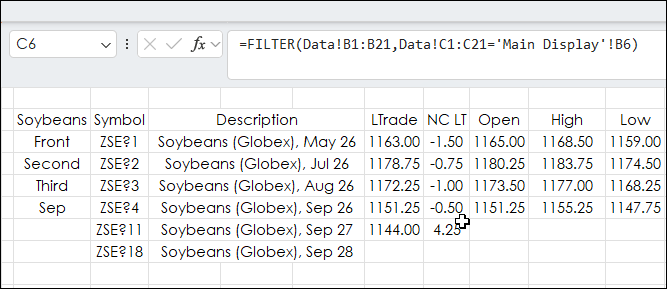
This Excel dashboard tracks agriculture markets and uses Excel's FILTER Function to pull the same month's contract data from each year.
The markets tracked are Soybeans, Soybean Meal,… more
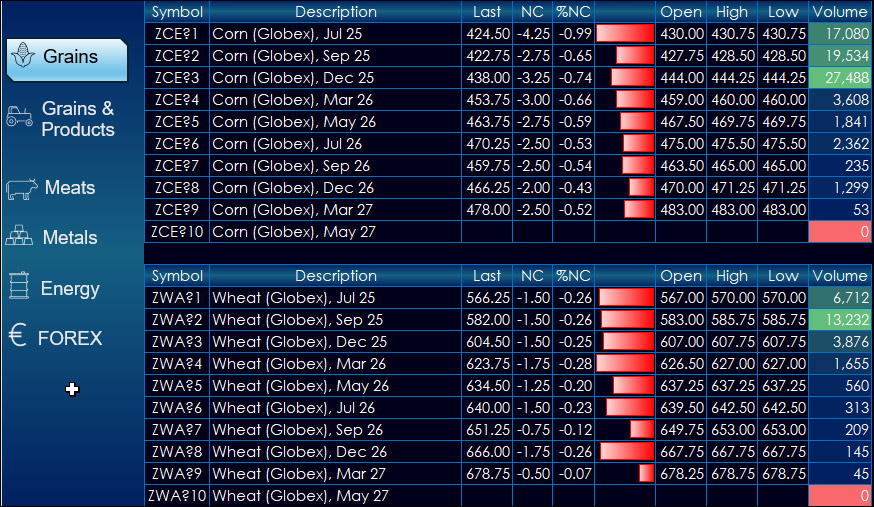
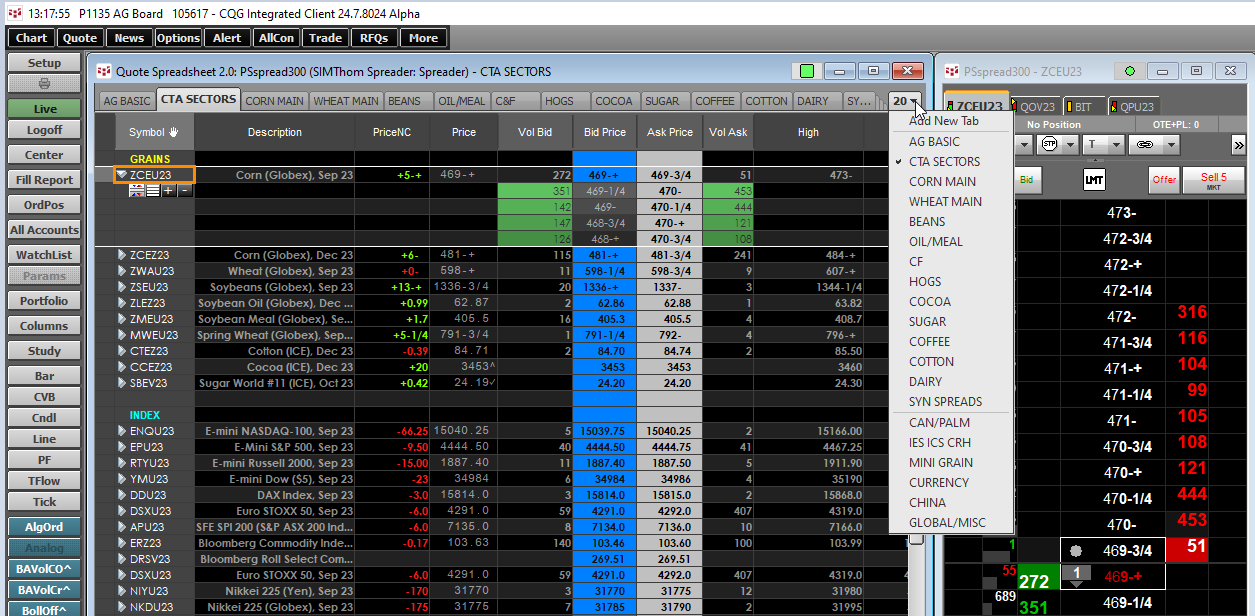
This dashboard provides market data for CME products. The dashboard uses a navigation bar instead of tabs.
The left-hand side provides market data for products. The right-hand side… more
This post details the downloadable Excel Market Performance Dashboard's features and functions. The dashboard has seven tabs (the first is data and the other tabs display a chart and a table of… more
The forward curves dashboard displays futures contracts White Maize (symbol: WMAZ), Yellow Maize (symbol: YMAZ), Wheat (symbol: WEAT), Soybeans (symbol: SOYA), and Sunflower Seeds (symbol: SUNS),… more
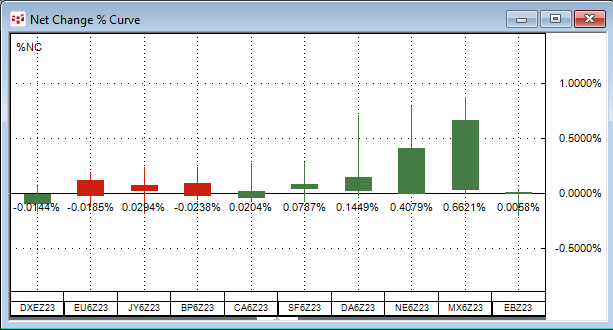
The Net Change Curve chart displays a collection of symbols’ daily net price change or daily net percentage change making it easy to compare on a relative basis each market’s current session’s… more
This post details two pages with a general overview of the agriculture markets. These pages are to help you navigate all the possible underlying contracts and data points you may or may not know… more
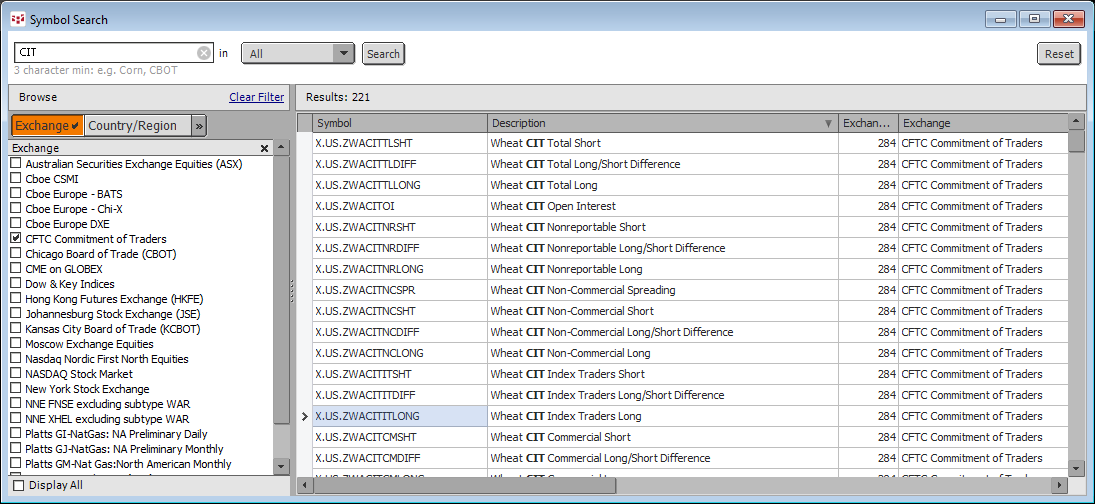
The Supplemental report is published for Futures-and-Options-Combined in selected agricultural markets and, in addition to showing all the information in the short format, shows positions of Index… more
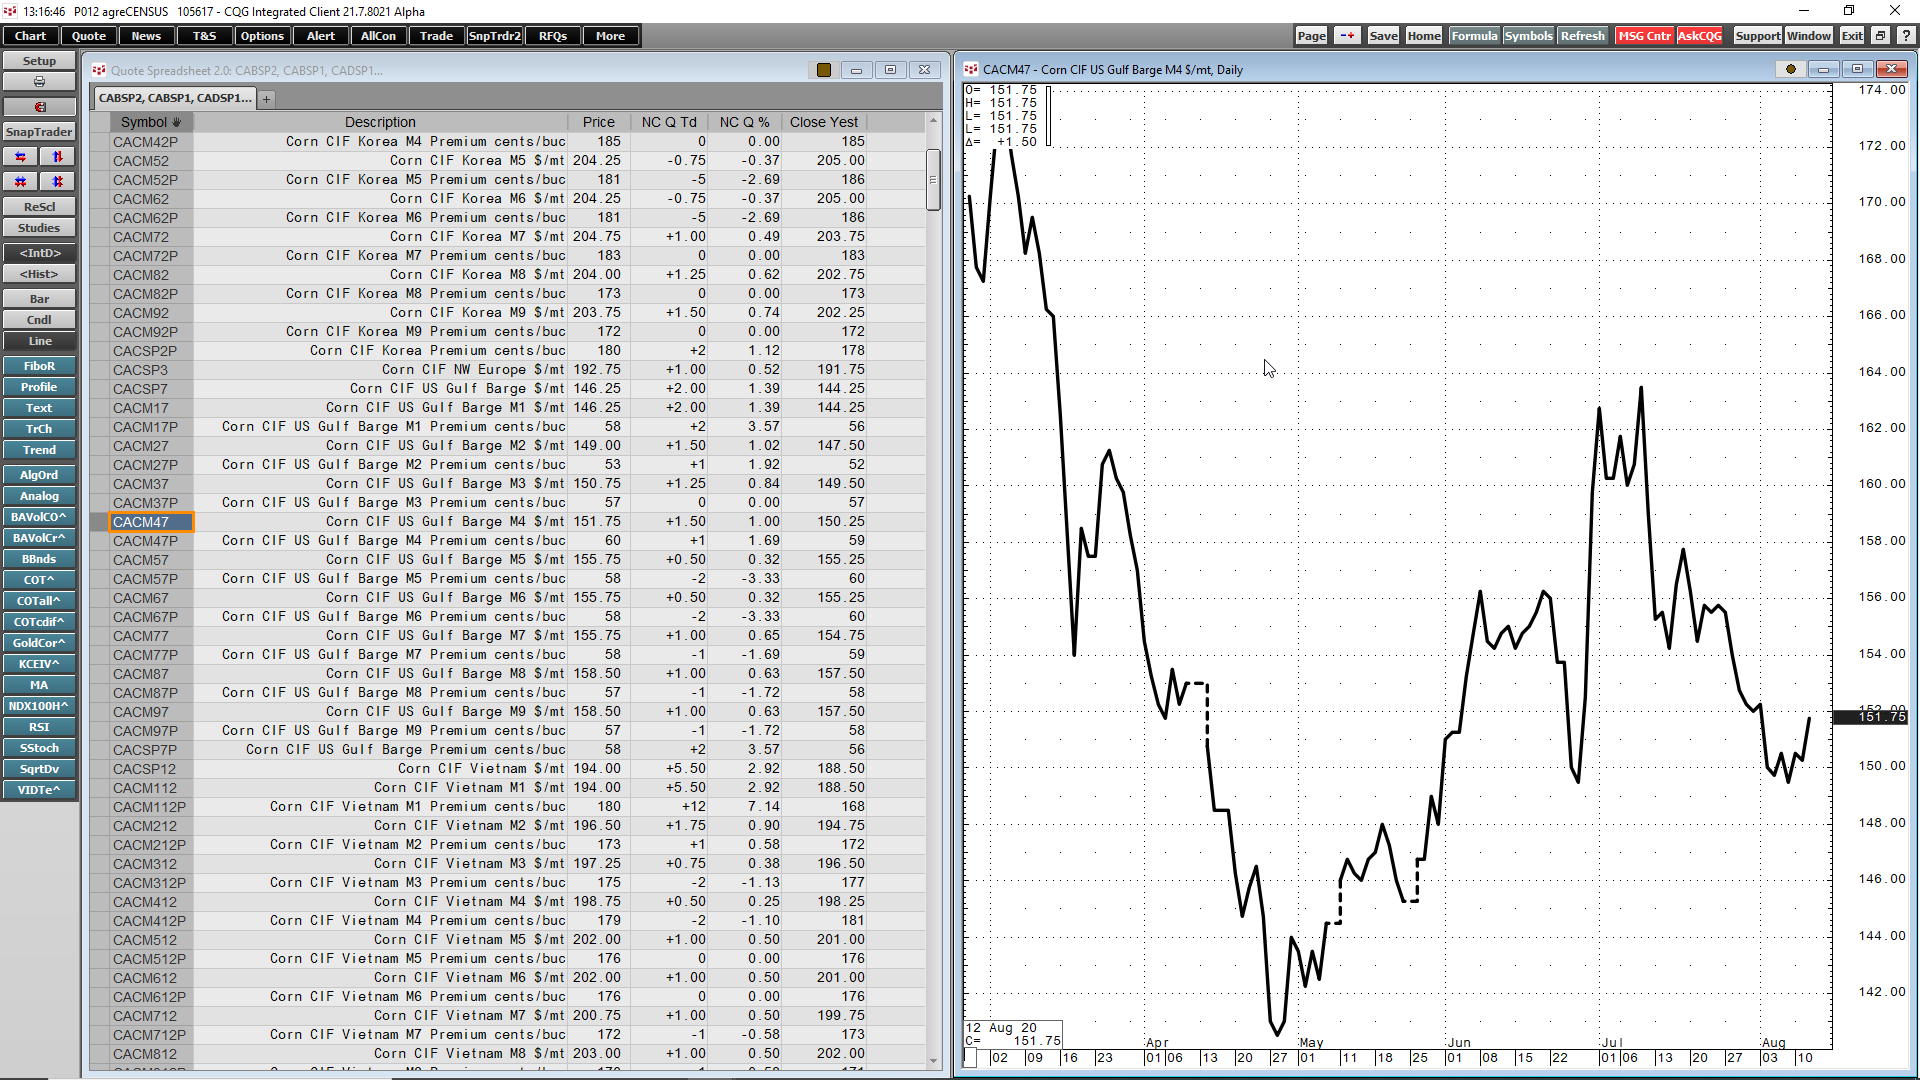
Maintain a global view of the price structure of the agricultural markets through Fastmarkets AgriCENSUS data.
Fastmarkets AgriCENSUS is an independent price reporting agency (PRA) that… more