Traders who look to forward curves for analysis can create forward curves using Excel RTD calls. This post details some ways to create forward curves and some "tricks" to make the forward curves… more
Workspaces
The forward curves dashboard displays futures contracts White Maize (symbol: WMAZ), Yellow Maize (symbol: YMAZ), Wheat (symbol: WEAT), Soybeans (symbol: SOYA), and Sunflower Seeds (symbol: SUNS),… more
This Microsoft® Excel dashboard uses RTD formulas based on a user input symbol (please use all capital letters) to display a forward curve of the outrights and forward curves for six calendar… more
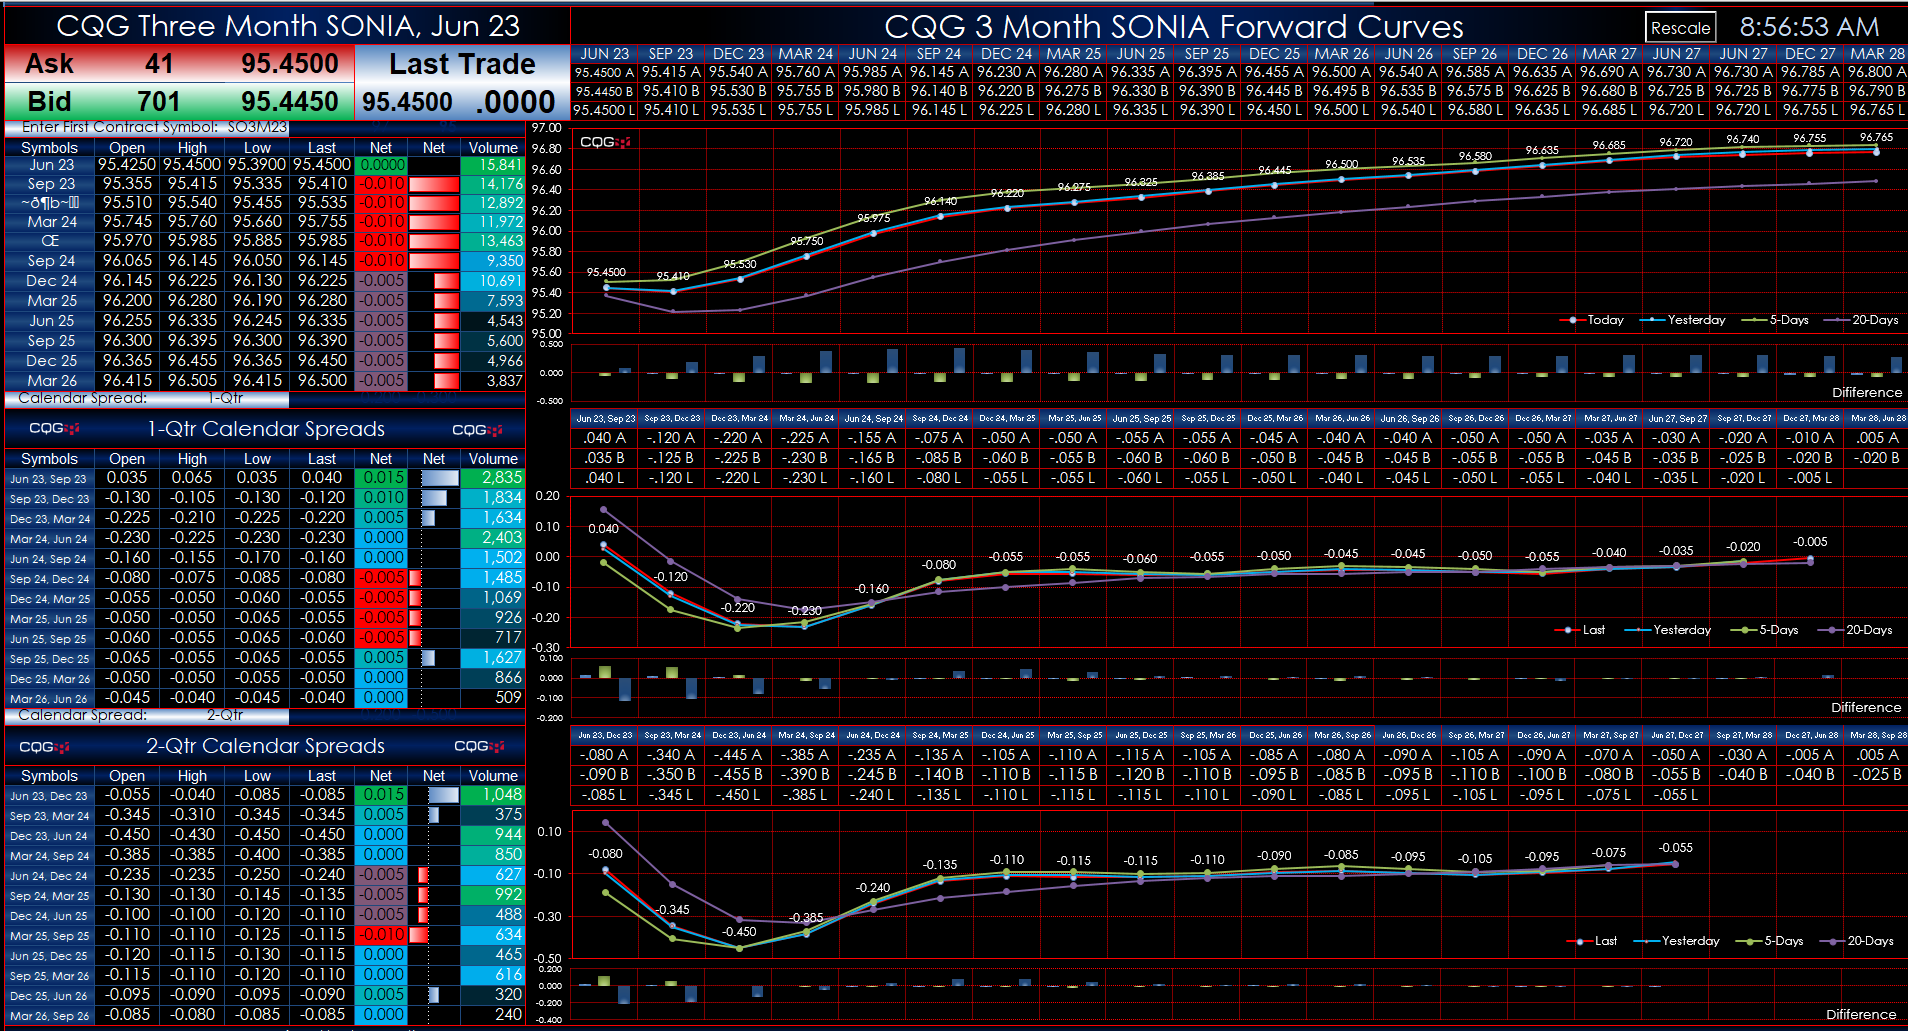
This Microsoft Excel® macro enabled dashboard pulls in the Three Month SONIA Index Futures Contract which is a cash settled future based on the interest rate on a three month sterling deposit.… more
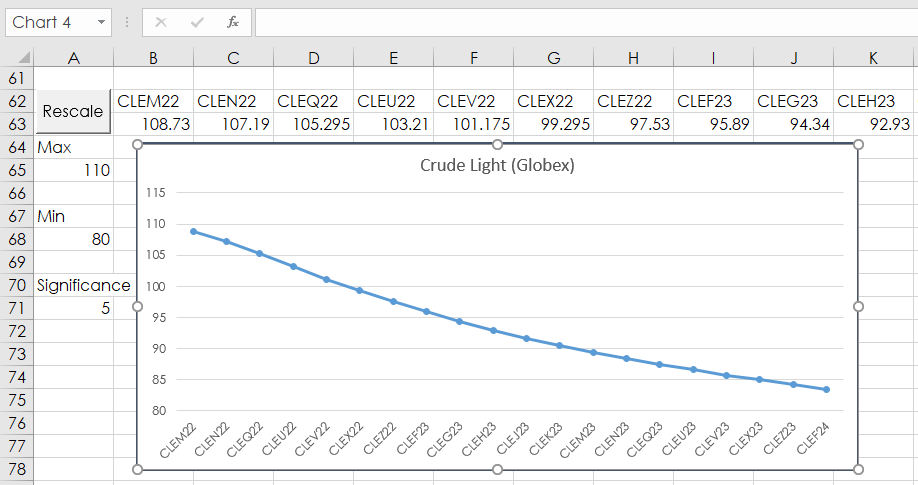
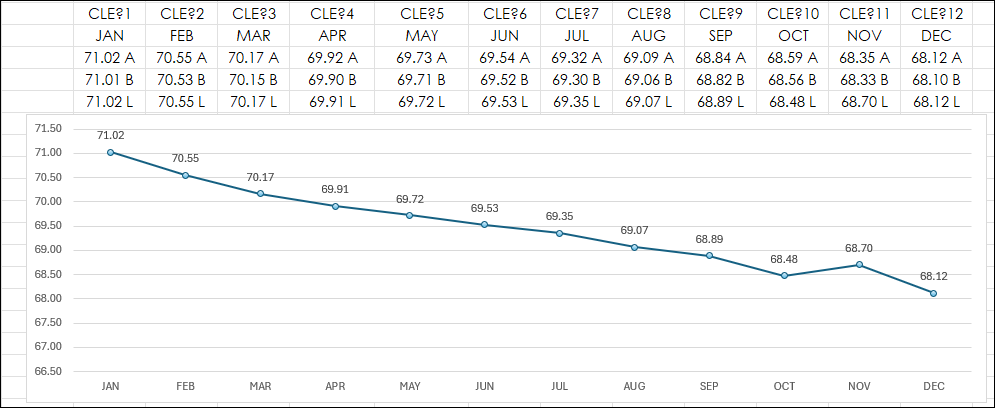
Monitoring market data in Excel may be enhanced by including Forward Curve charts. However, there are issues with Excel charting and the purpose of this post is to offer solutions using Excel… more
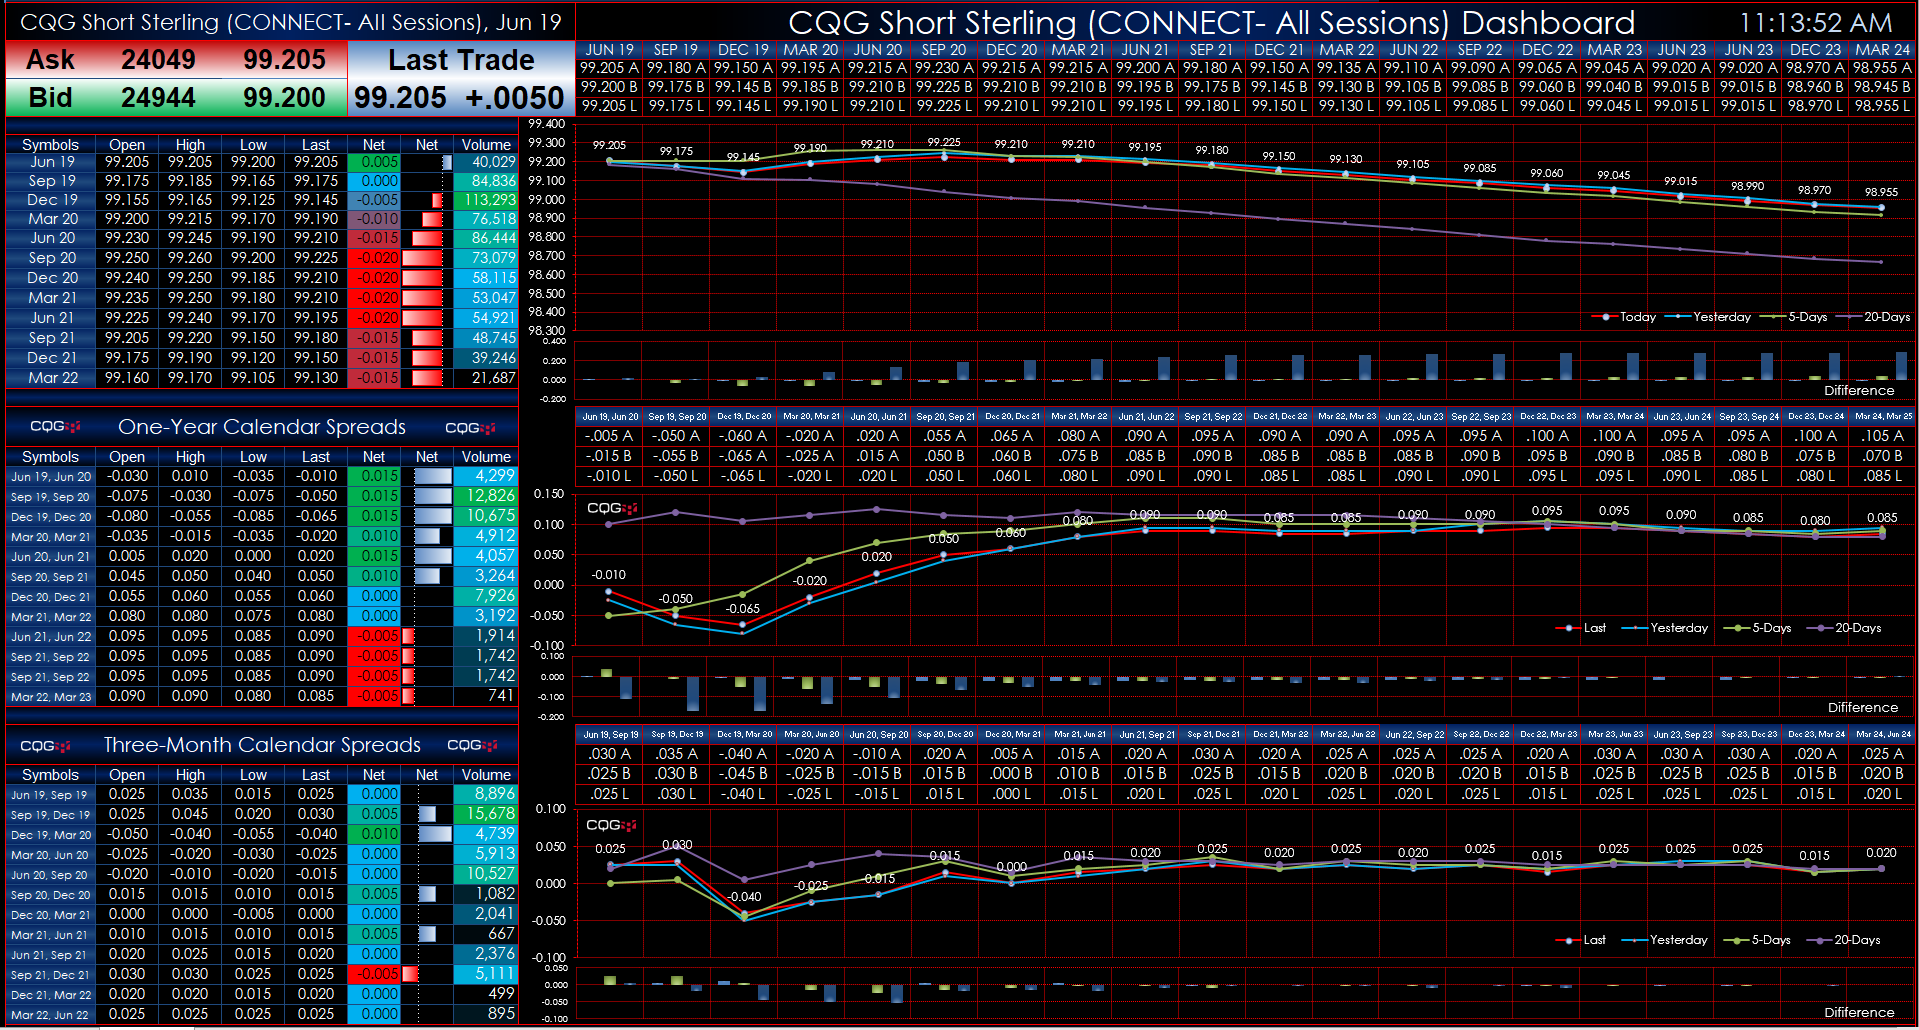
This Microsoft Excel® dashboard pulls in the Short Sterling market data traded on the ICE platform. There are three forward curve charts. The first chart displays the quarterly contracts forward… more

This Microsoft Excel® dashboard pulls in the Euribor market data traded on the ICE platform.
There are three forward curve charts. The first one displays the quarterly contracts… more
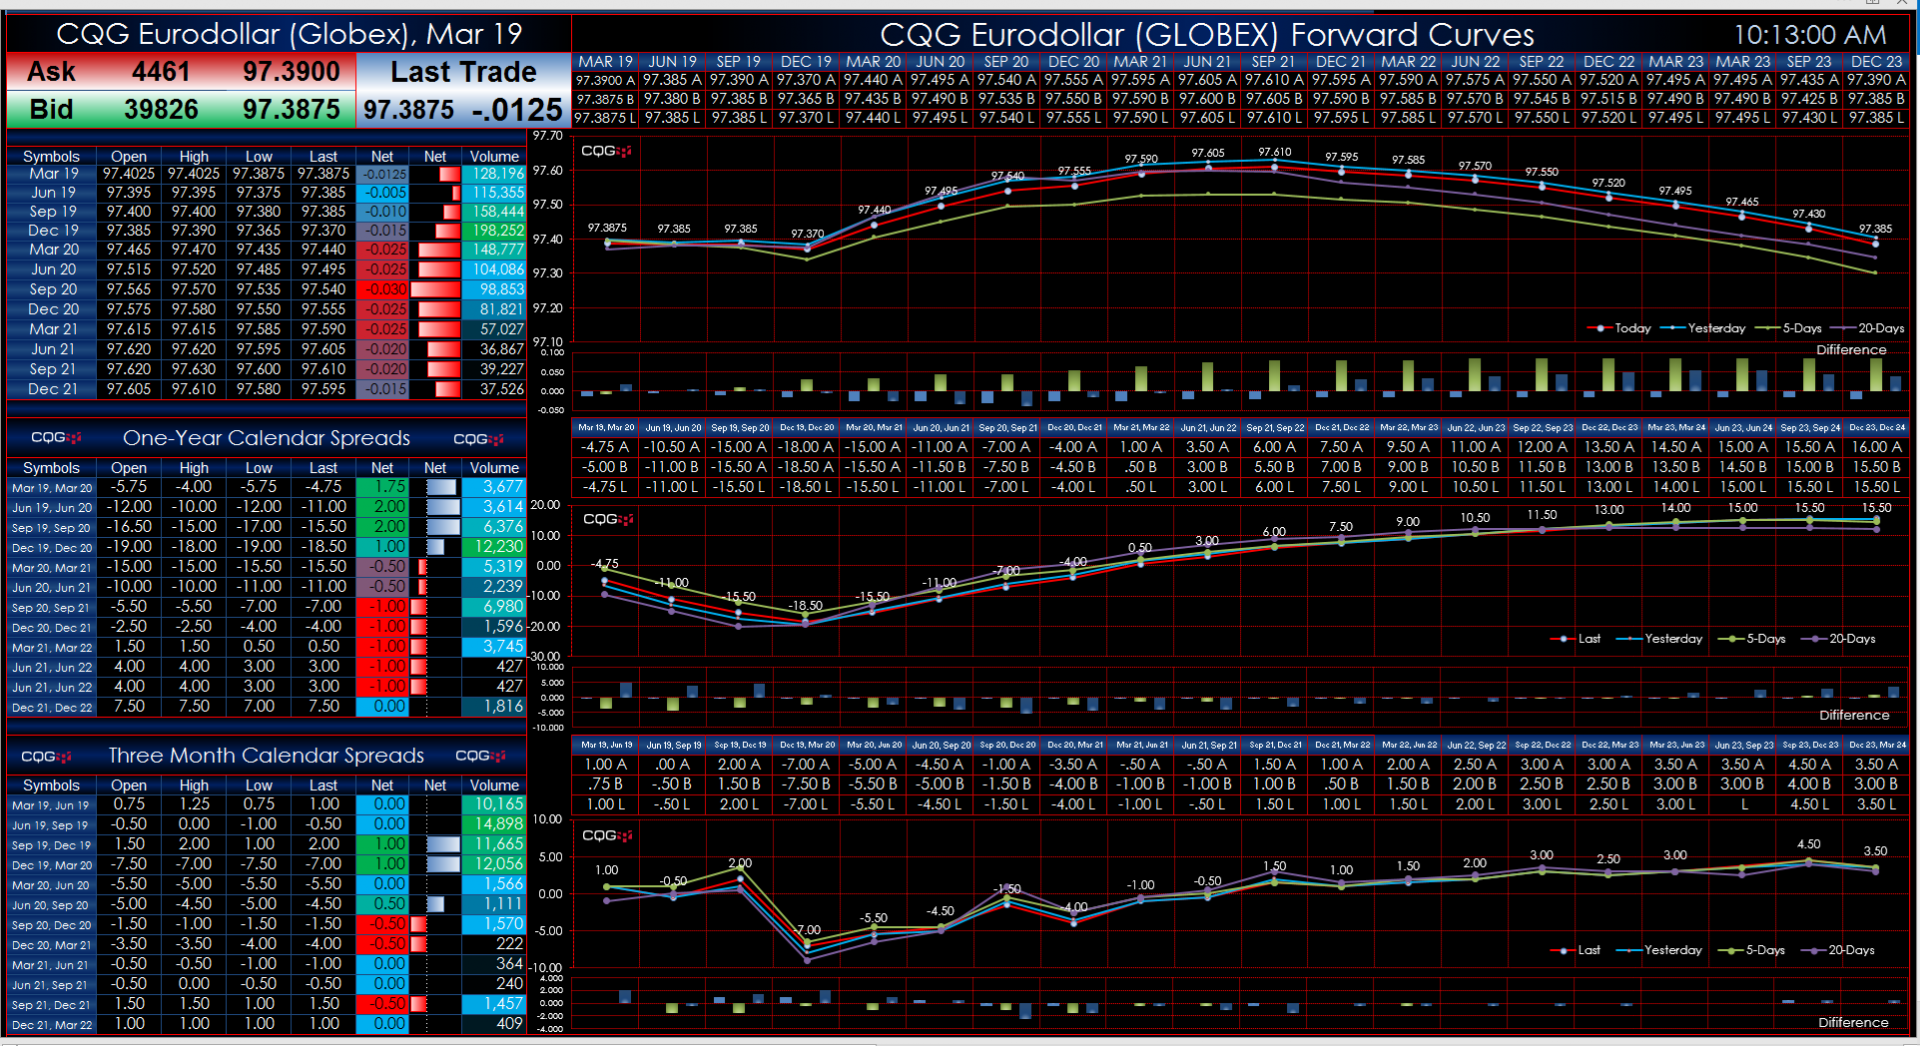
This Microsoft Excel® dashboard pulls in the Eurodollar market data traded on the CME Globex platform.
There are three forward curve charts. The first one displays the… more
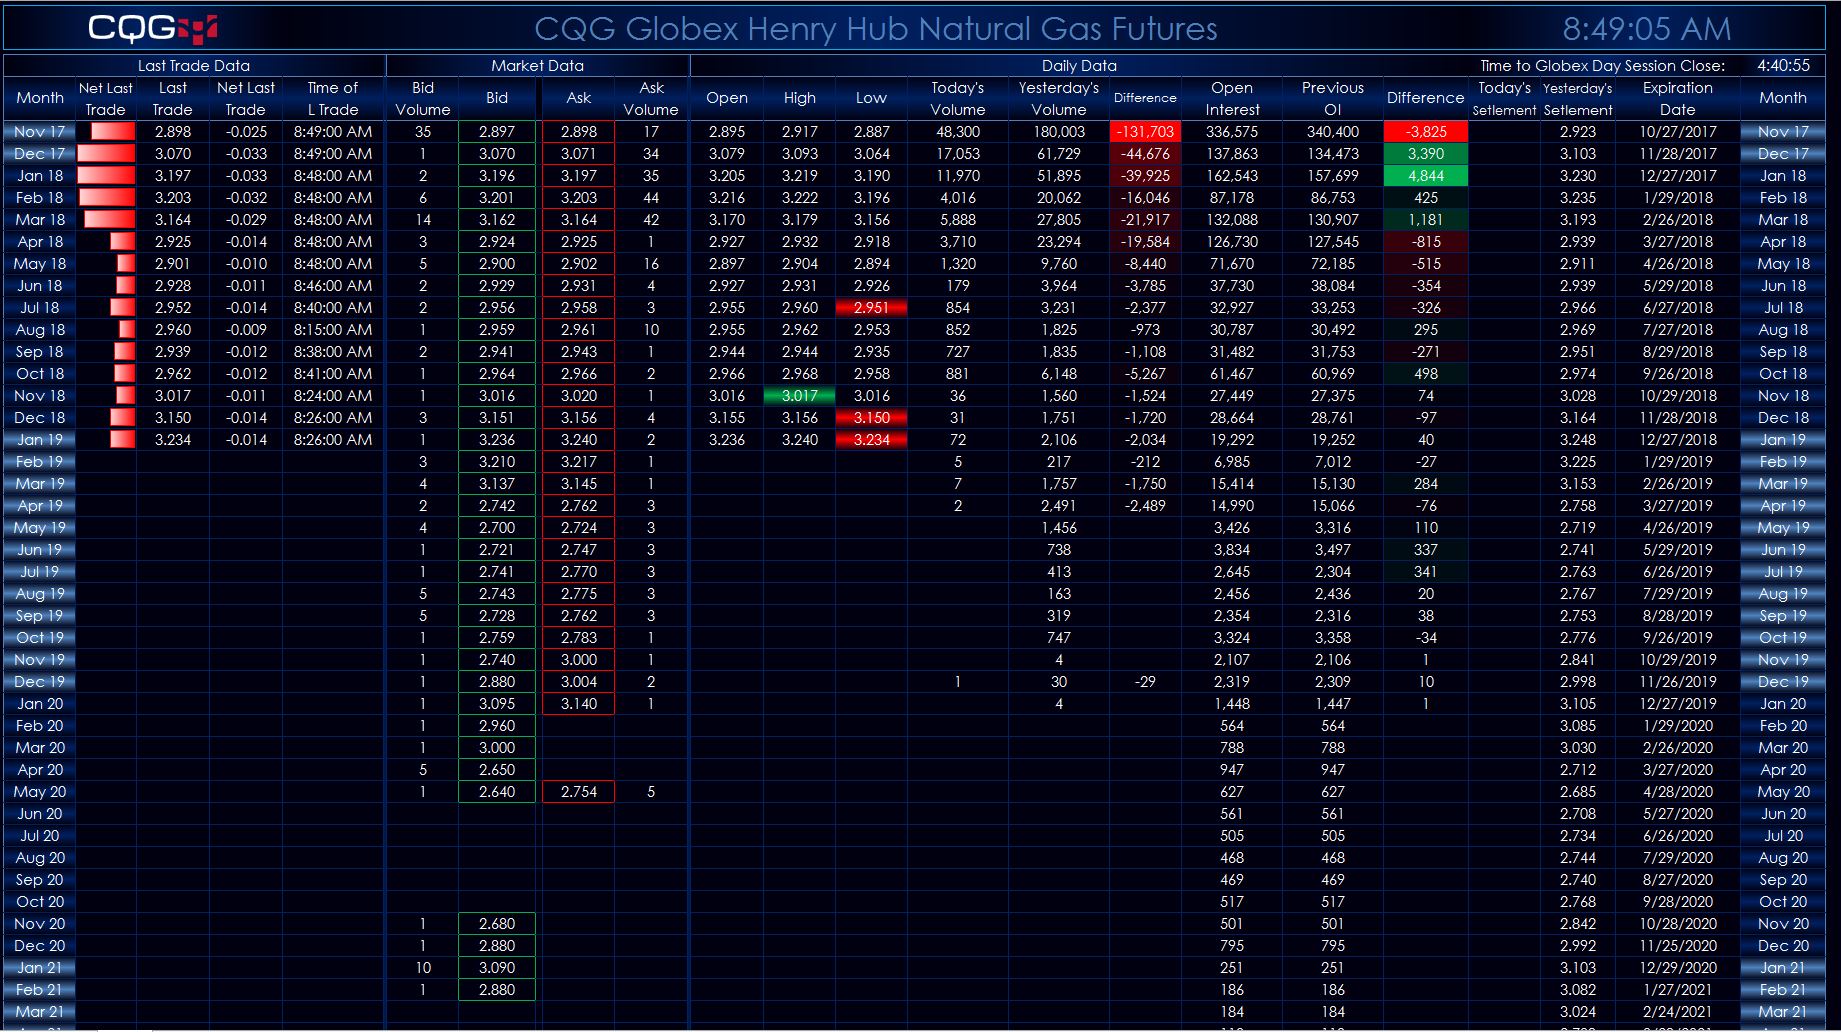
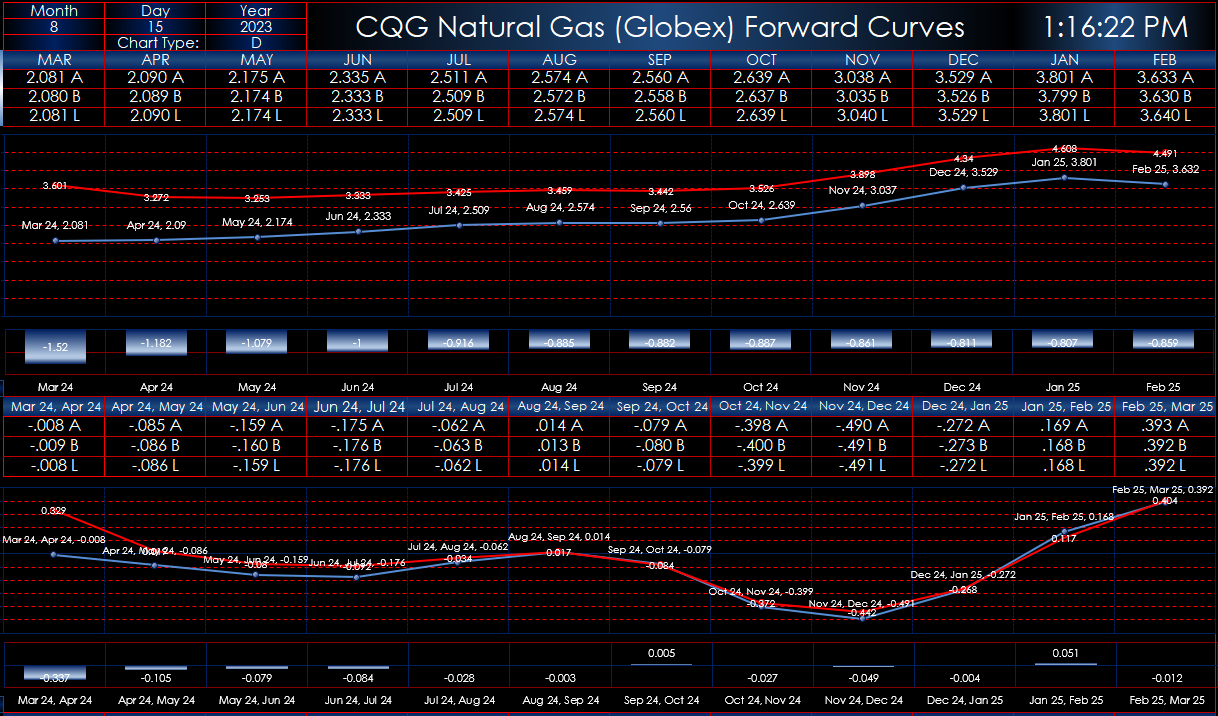
This Microsoft Excel® dashboard has three tabs. The first tab displays today’s market quotes, volume, and open interest data. If the last price is matching the open price, then the open price… more
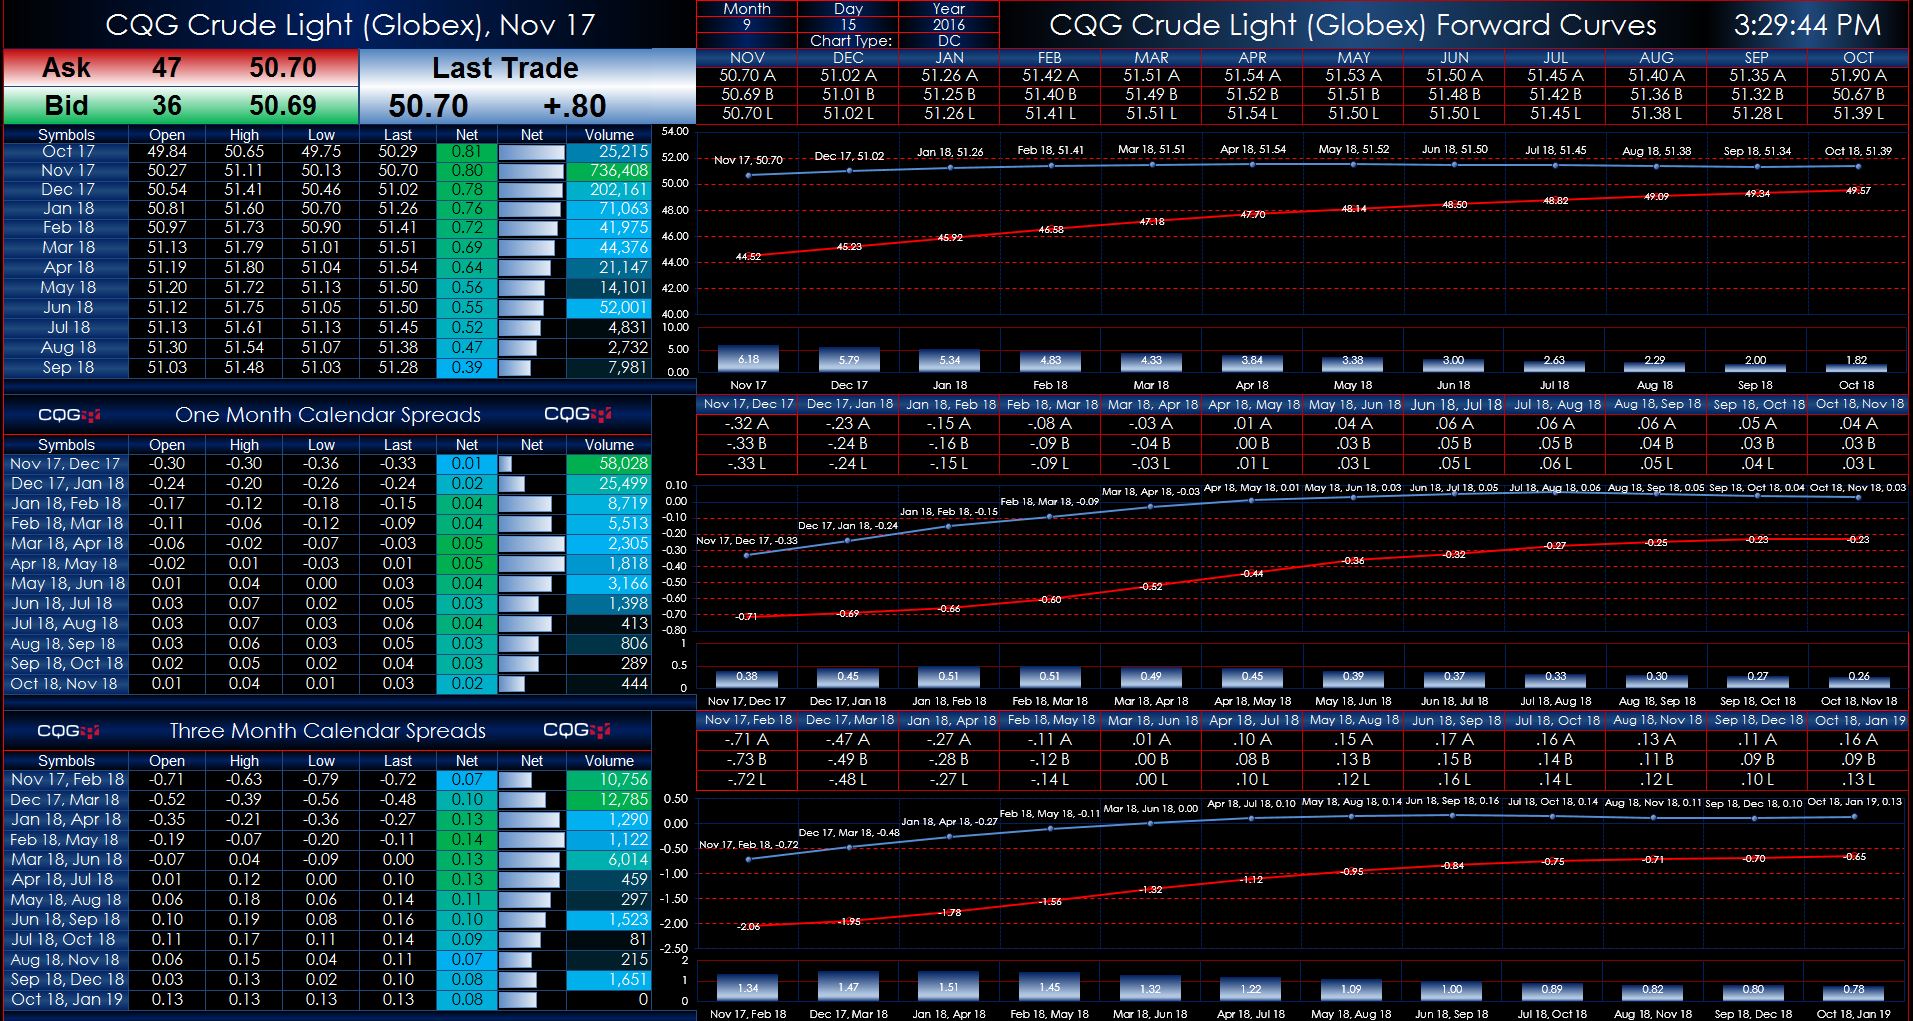
These two Microsoft Excel® spreadsheets present Globex crude oil market data and forward curves, both current and historical. Two dashboards are available: The first the data includes outrights… more