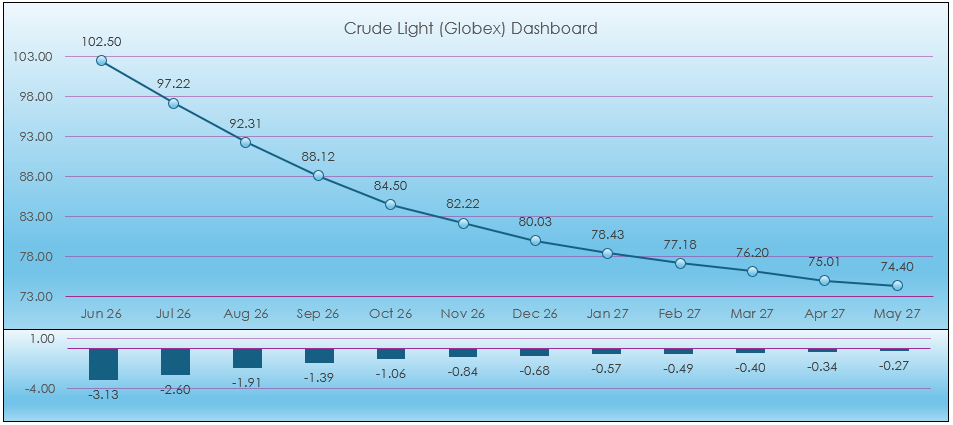
This post presents a macro enabled Excel Light Crude Oil dashboard using combined functionality detailed in previous Workspace posts. The dashboard uses numerous RTD calls for today's market… more
Workspaces
This post is similar to the recent post "Excel 365 GROUPBY and XLOOKUP".
That post introduced using the Excel function GROUPBY to arrange by sectors the stocks in the NASDAQ 100 and identify… more
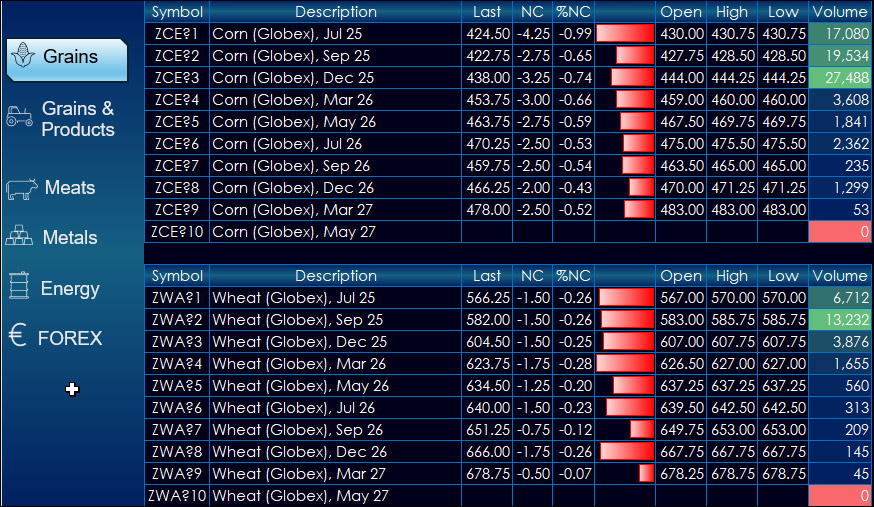
This dashboard provides market data for CME products. The dashboard uses a navigation bar instead of tabs.
The left-hand side provides market data for products. The right-hand side… more
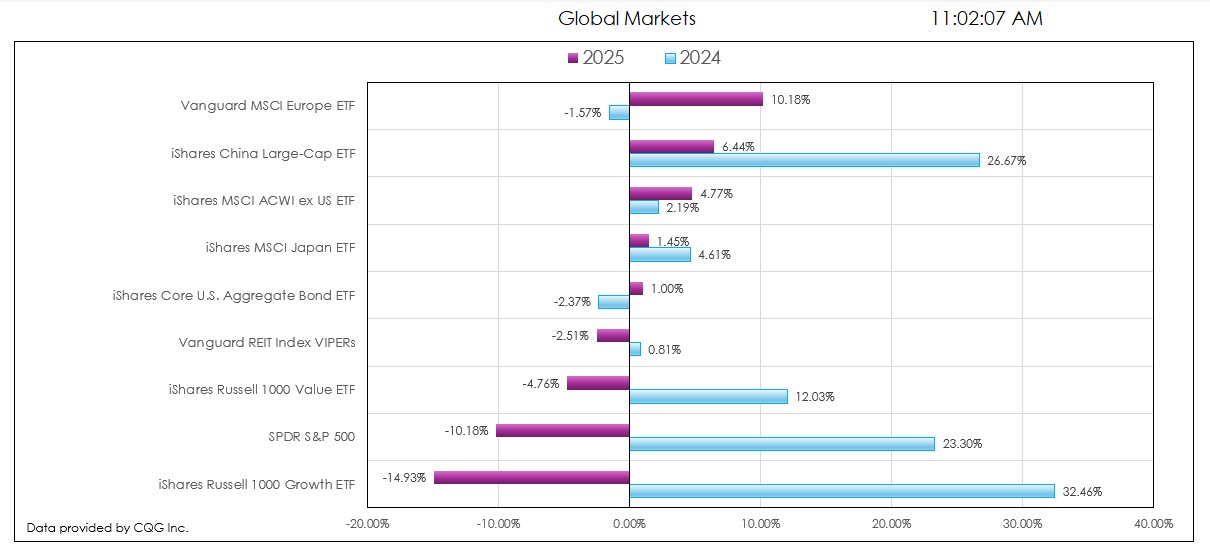
This post details the downloadable Excel Market Performance Dashboard's features and functions. The dashboard has seven tabs (the first is data and the other tabs display a chart and a table of… more
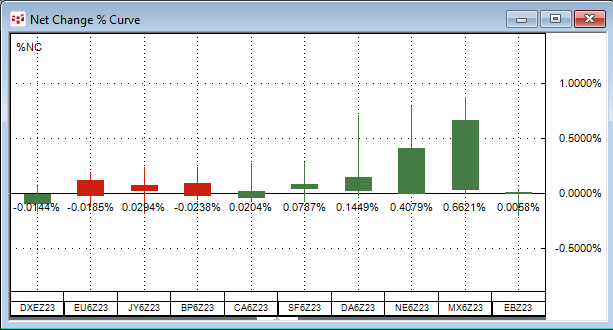
The Net Change Curve chart displays a collection of symbols’ daily net price change or daily net percentage change making it easy to compare on a relative basis each market’s current session’s… more
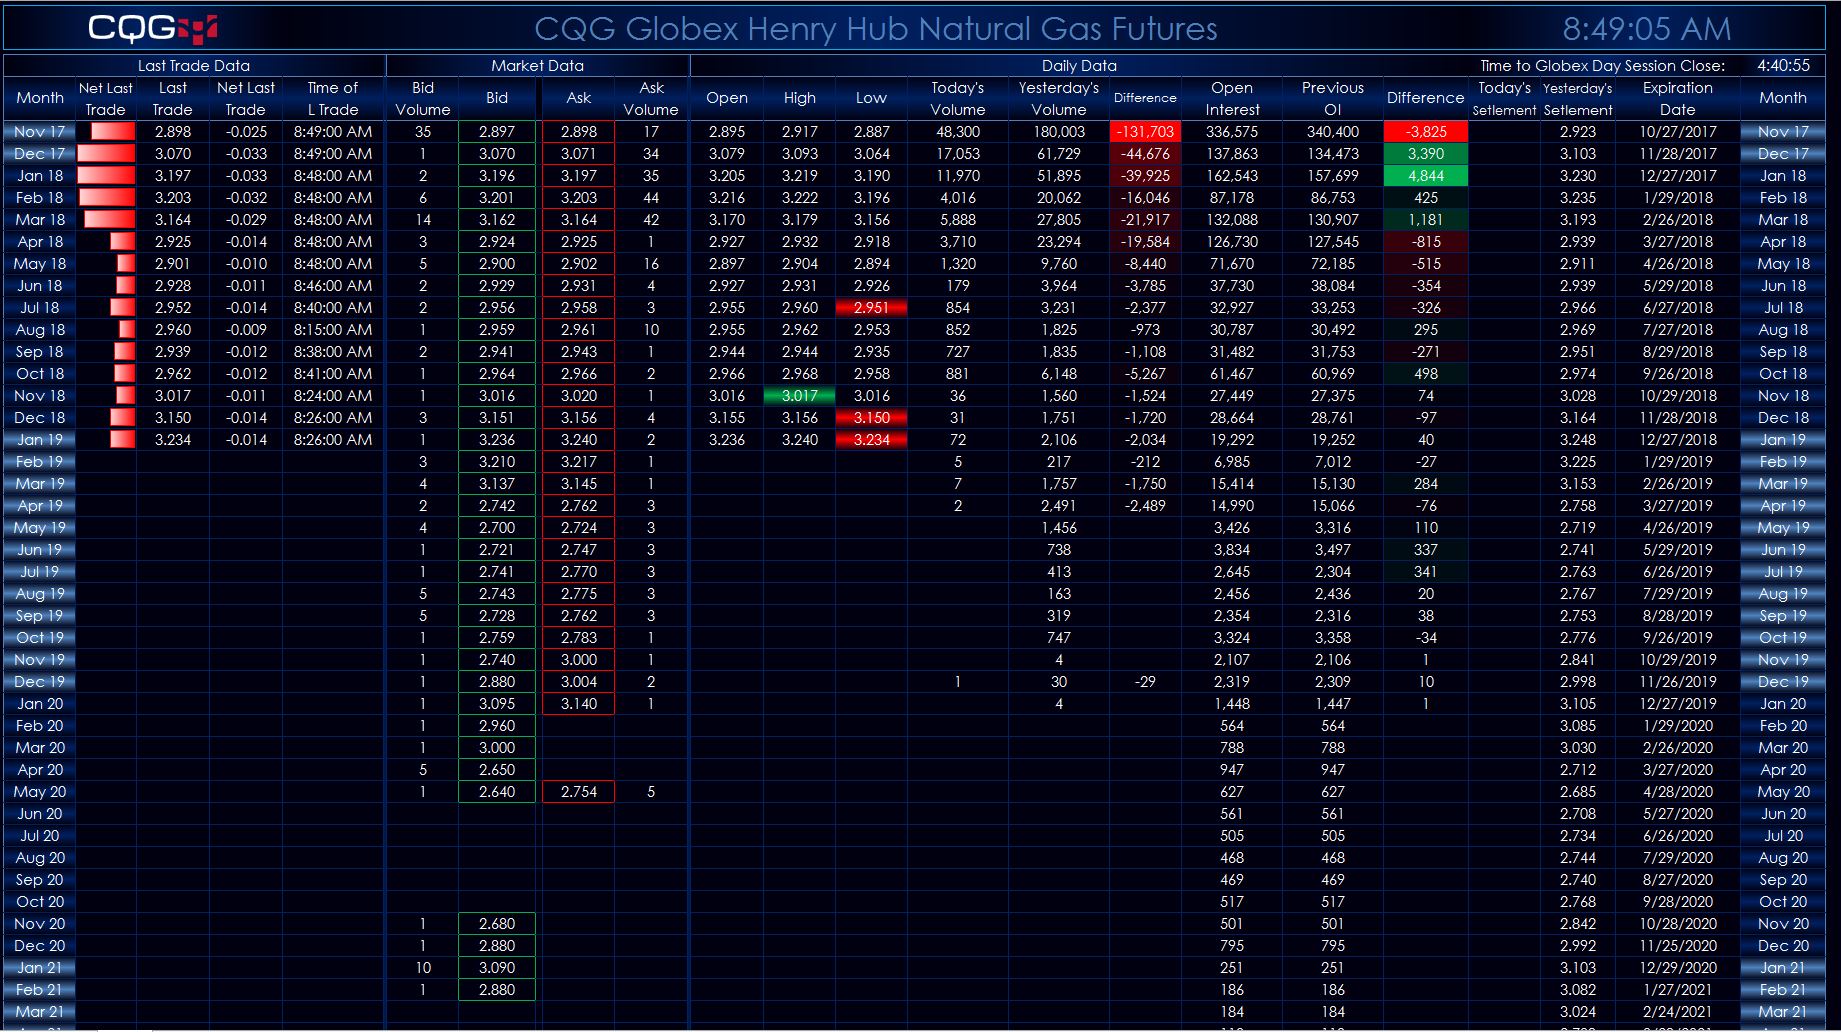
This Microsoft Excel® dashboard has three tabs. The first tab displays today’s market quotes, volume, and open interest data. If the last price is matching the open price, then the open price… more
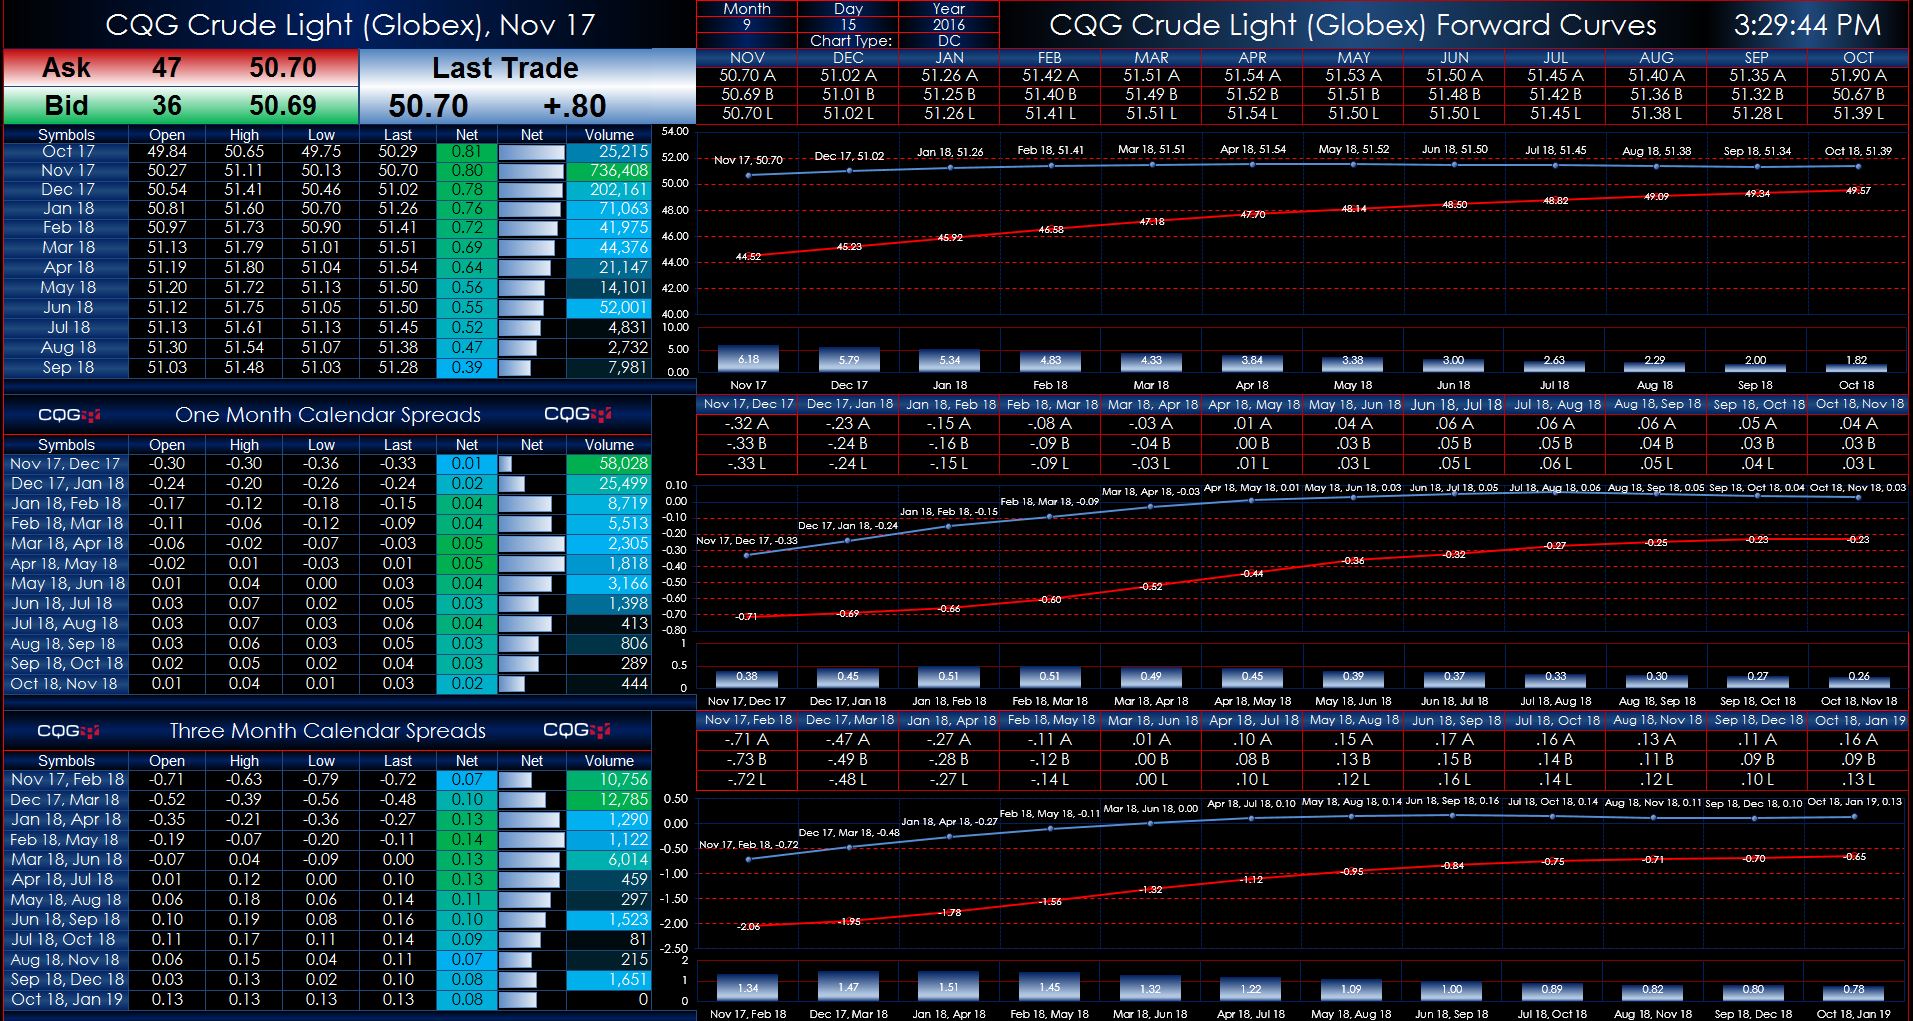
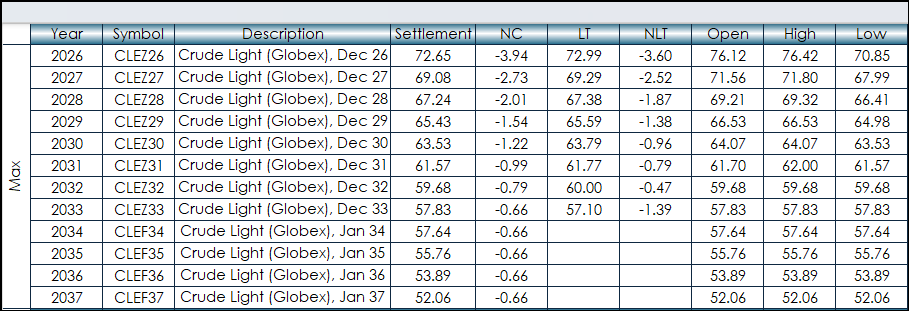
These two Microsoft Excel® spreadsheets present Globex crude oil market data and forward curves, both current and historical. Two dashboards are available: The first the data includes outrights… more