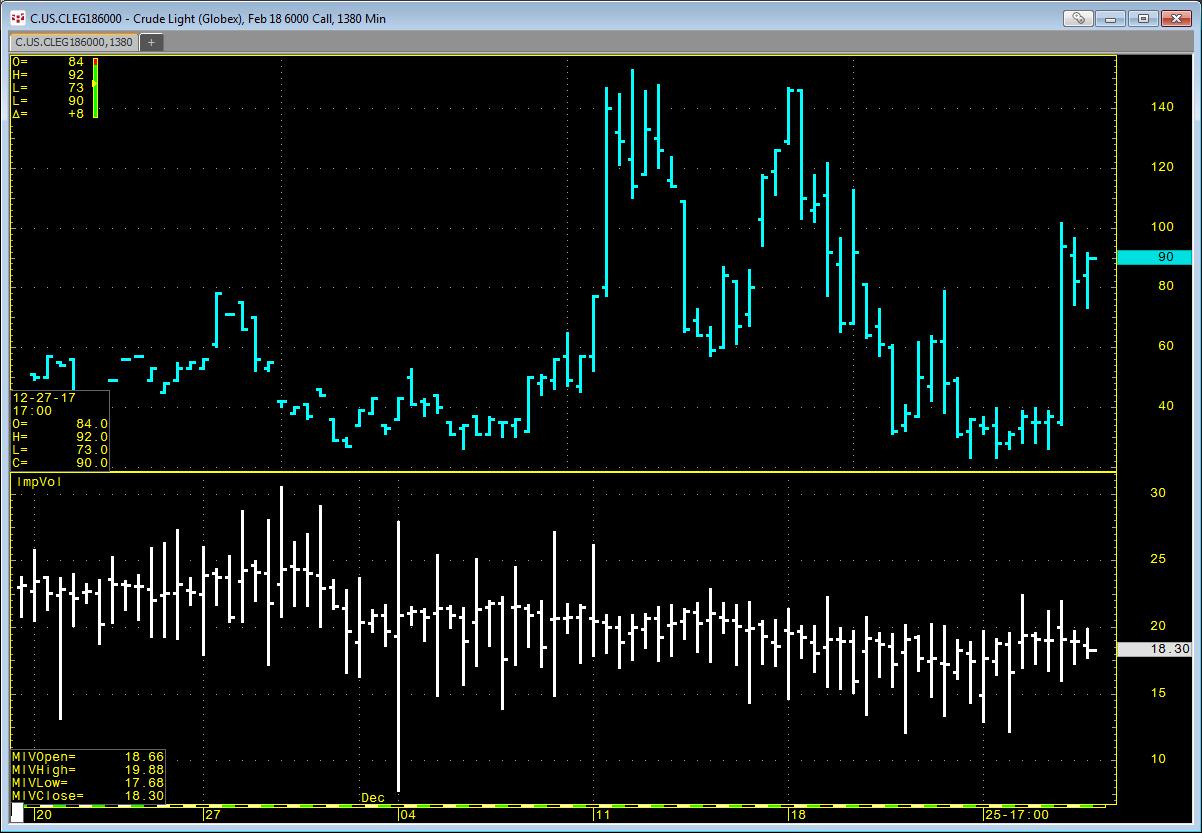
CQG offers an Implied Volatility (ImpVol) study that allows you to pull in historical implied volatility data onto a chart. ImpVol is not the implied volatility of one particular option.… more
Workspaces
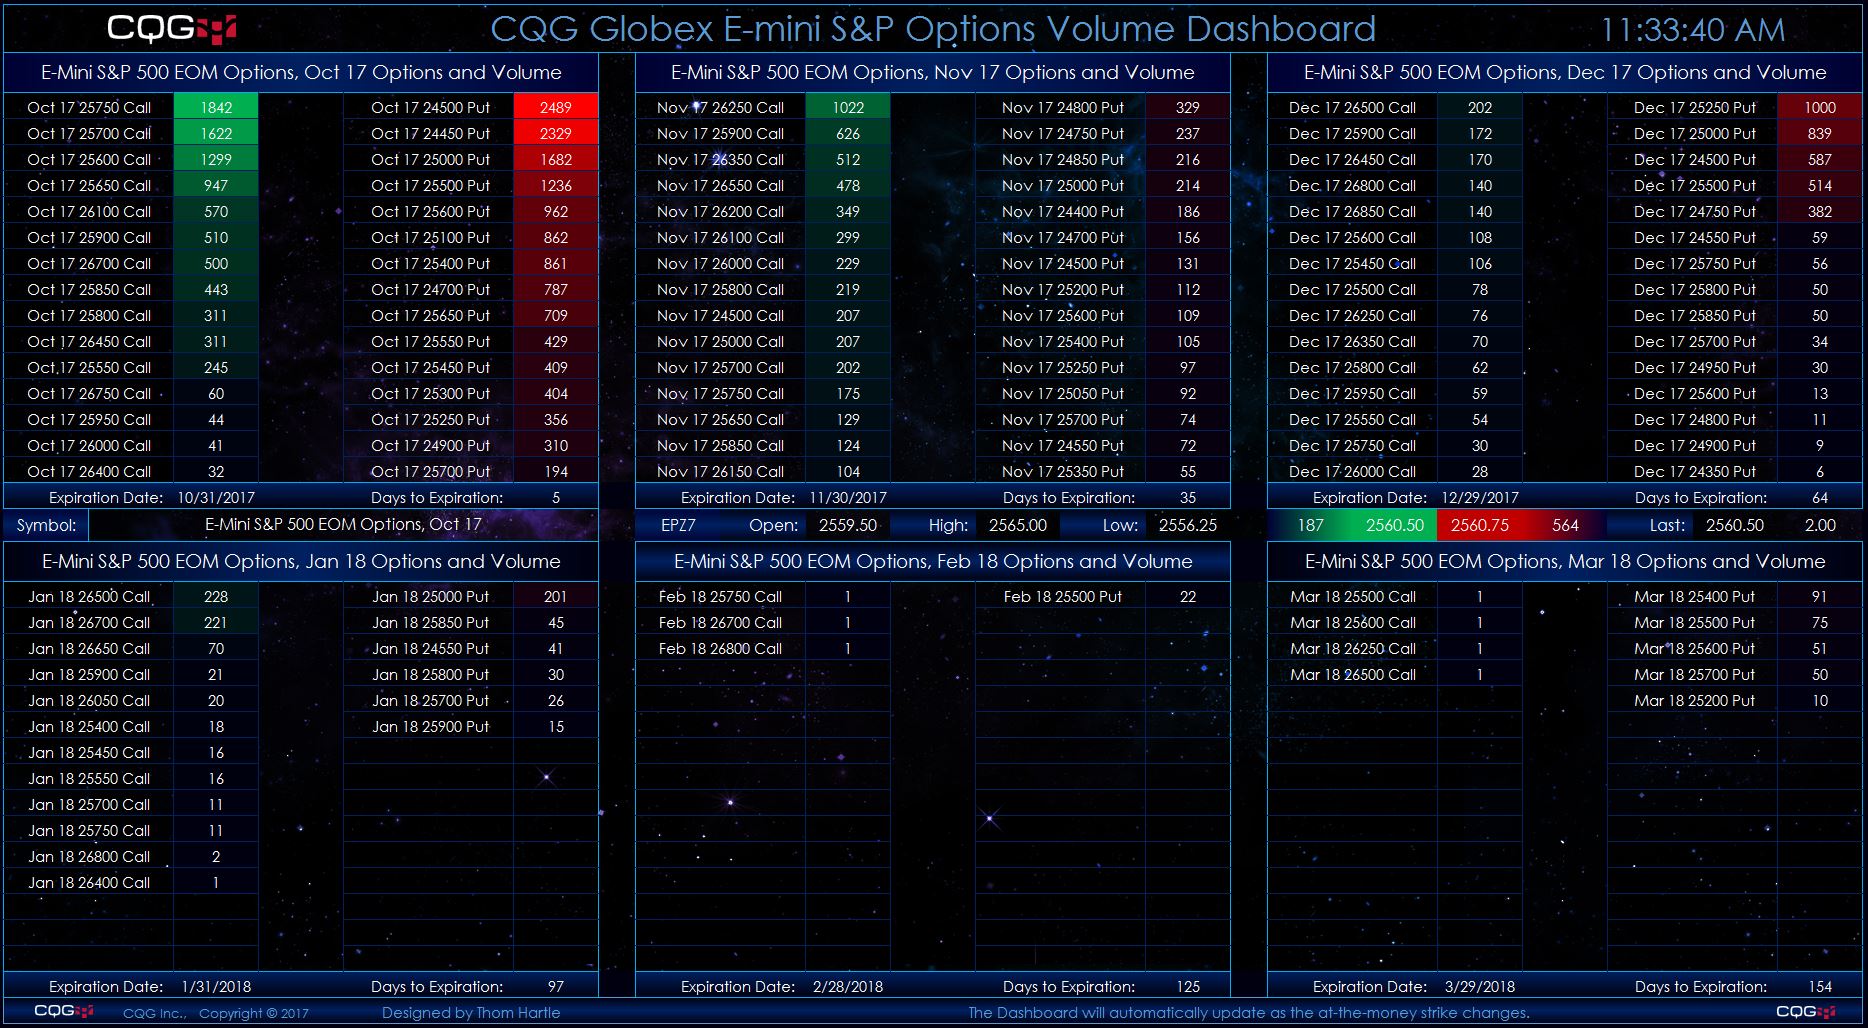
This Microsoft Excel® dashboard scans options on the E-mini S&P 500 futures market using the CQG RTD Toolkit for volume and displays strikes ranked by the volume traded for each listed expiry… more
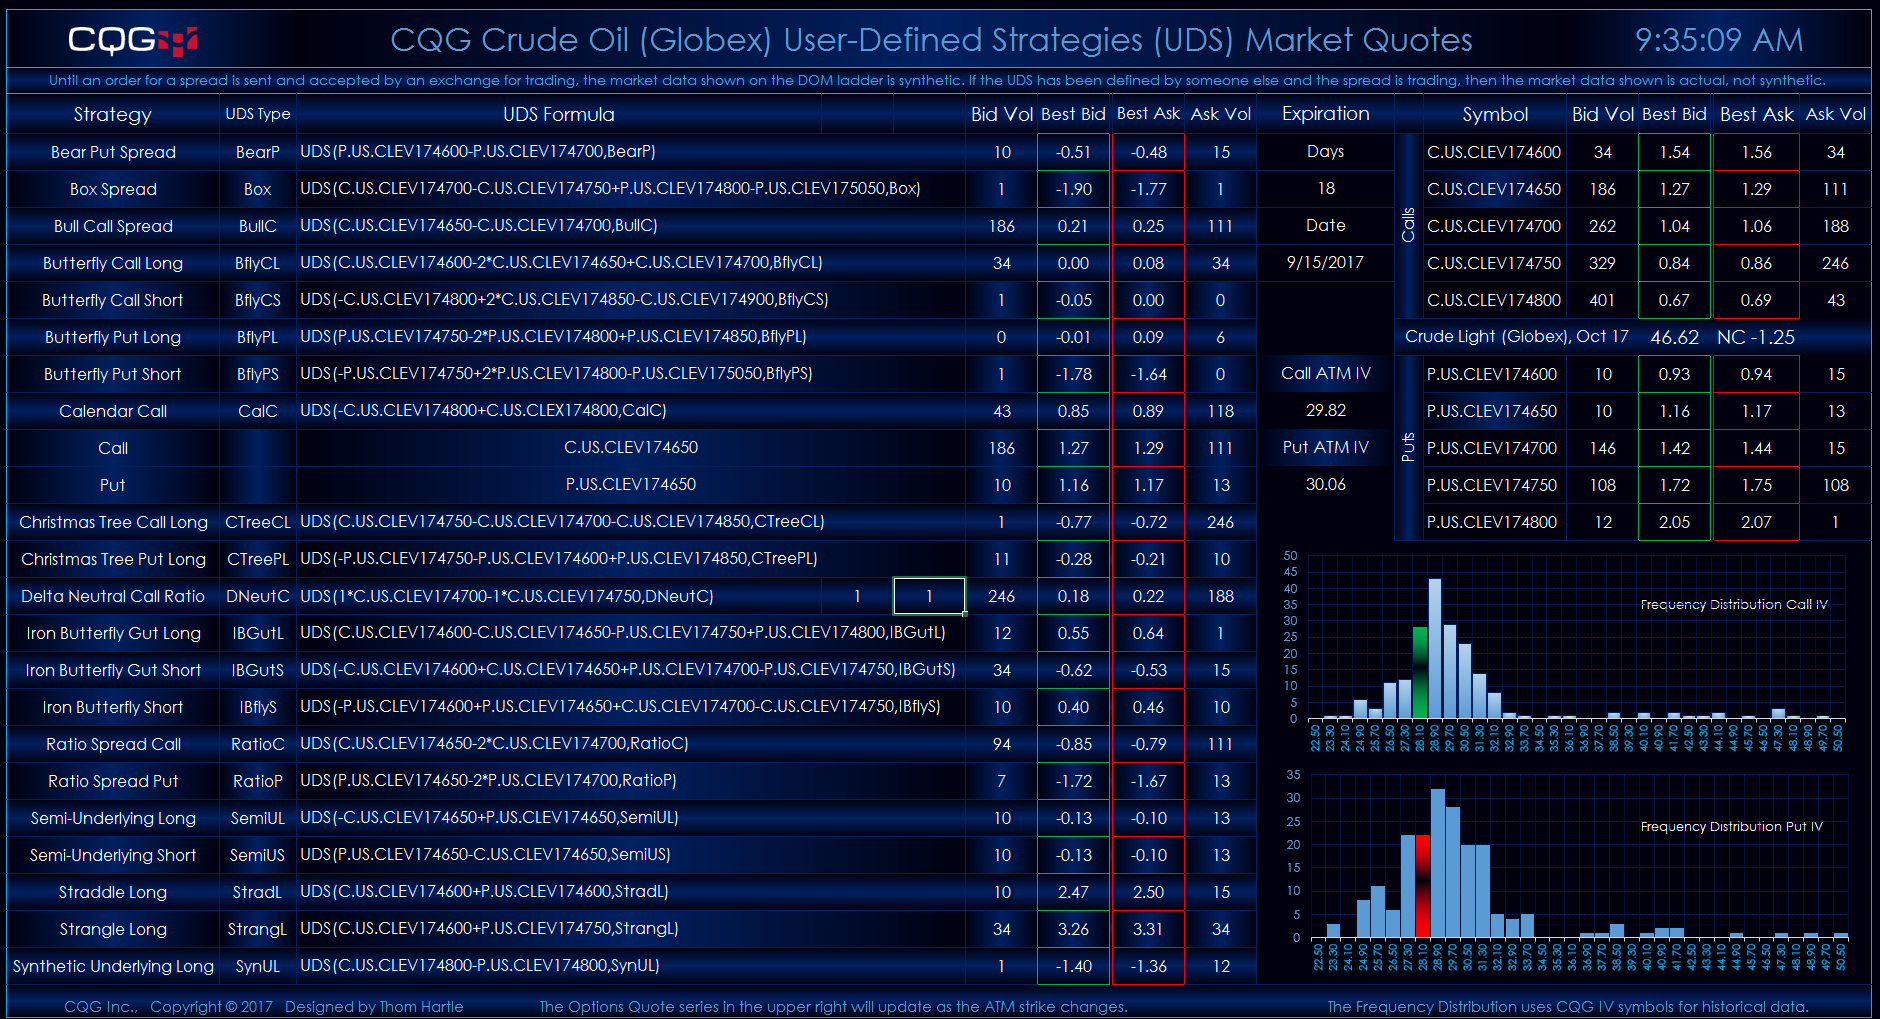
These two Microsoft Excel® dashboard display market quotes for tradable UDS for the crude oil contract and the E-mini S&P 500 traded on Globex. There is also a quote display with at-… more
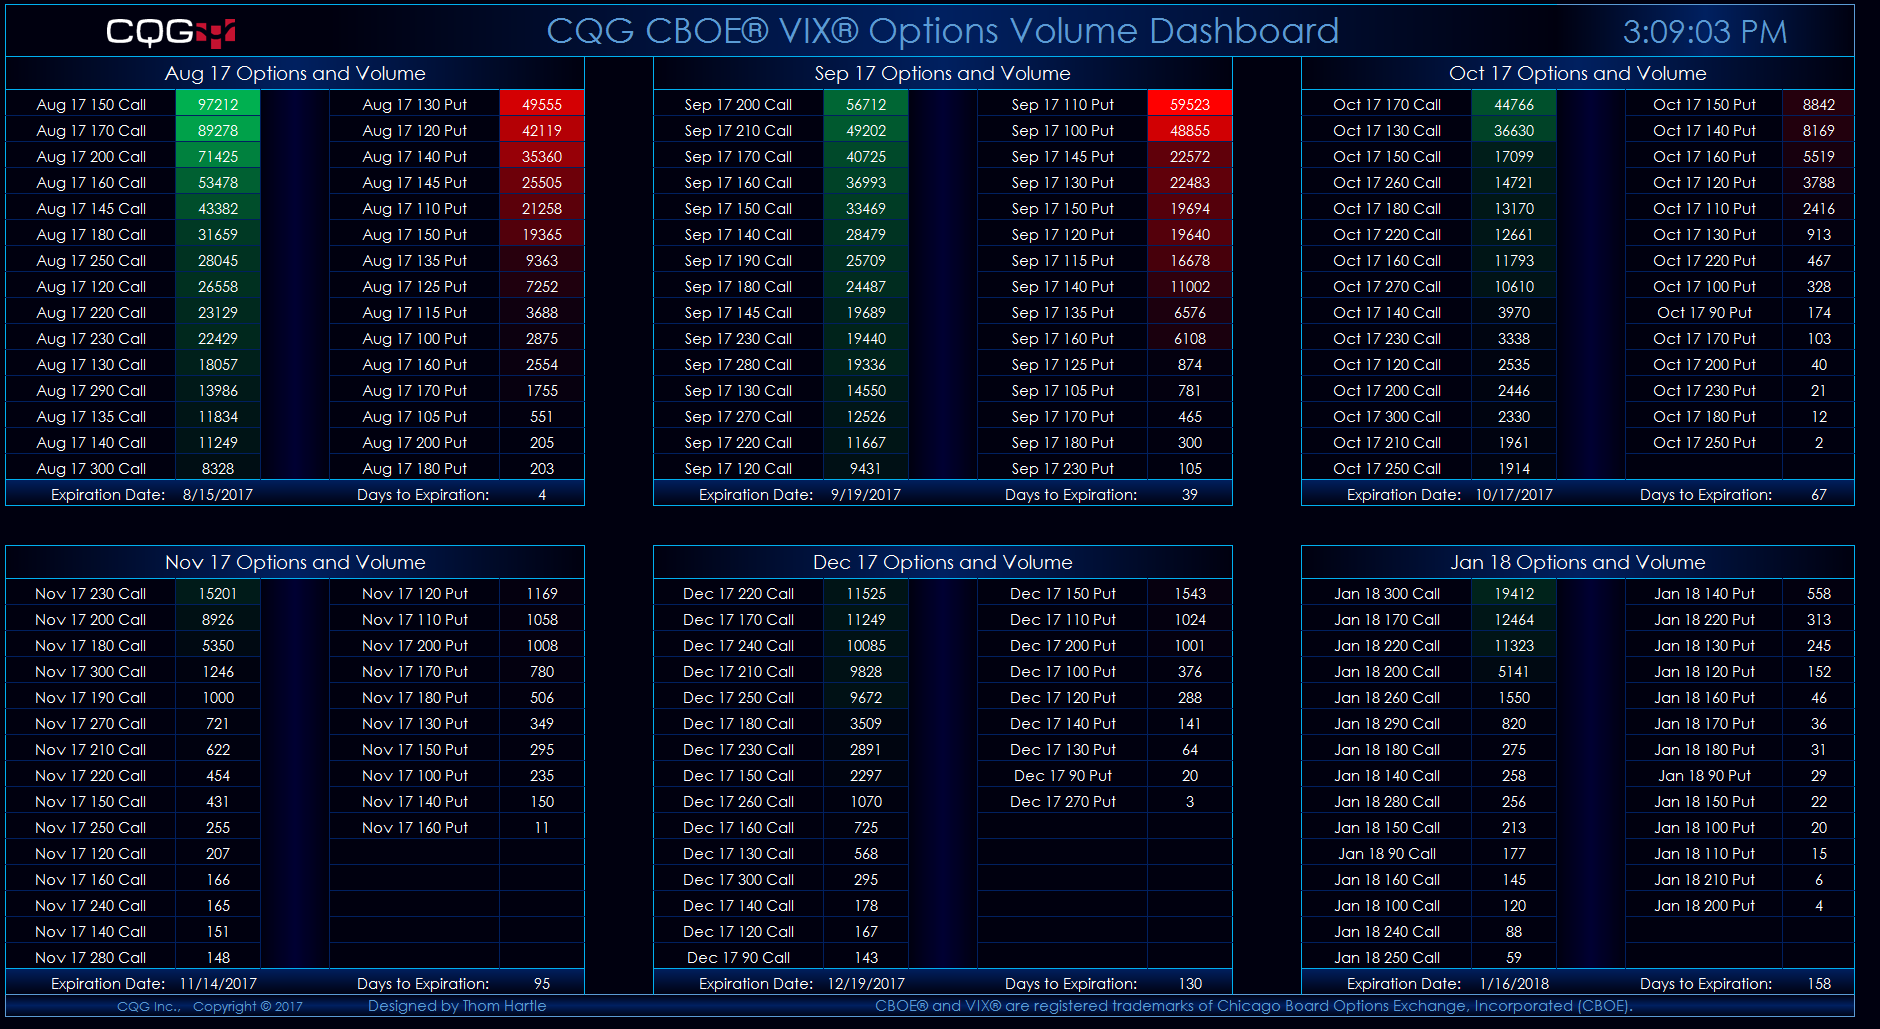
This Microsoft Excel® dashboard scans the VIX (CBOE) options market for volume and displays the strikes ranked by the volume traded for each expiry listed. The scan covers options traded 15… more

This Microsoft Excel® dashboard scans the options on futures for the H-shares Index (HHI) and ranks the traded volume for each expiry out to nine expirations. The scan covers options traded… more
This Microsoft Excel® dashboard scans the Hang Seng Index market options on futures and ranks the traded volume for each expiry out to eleven expirations. The scan covers options traded ten… more
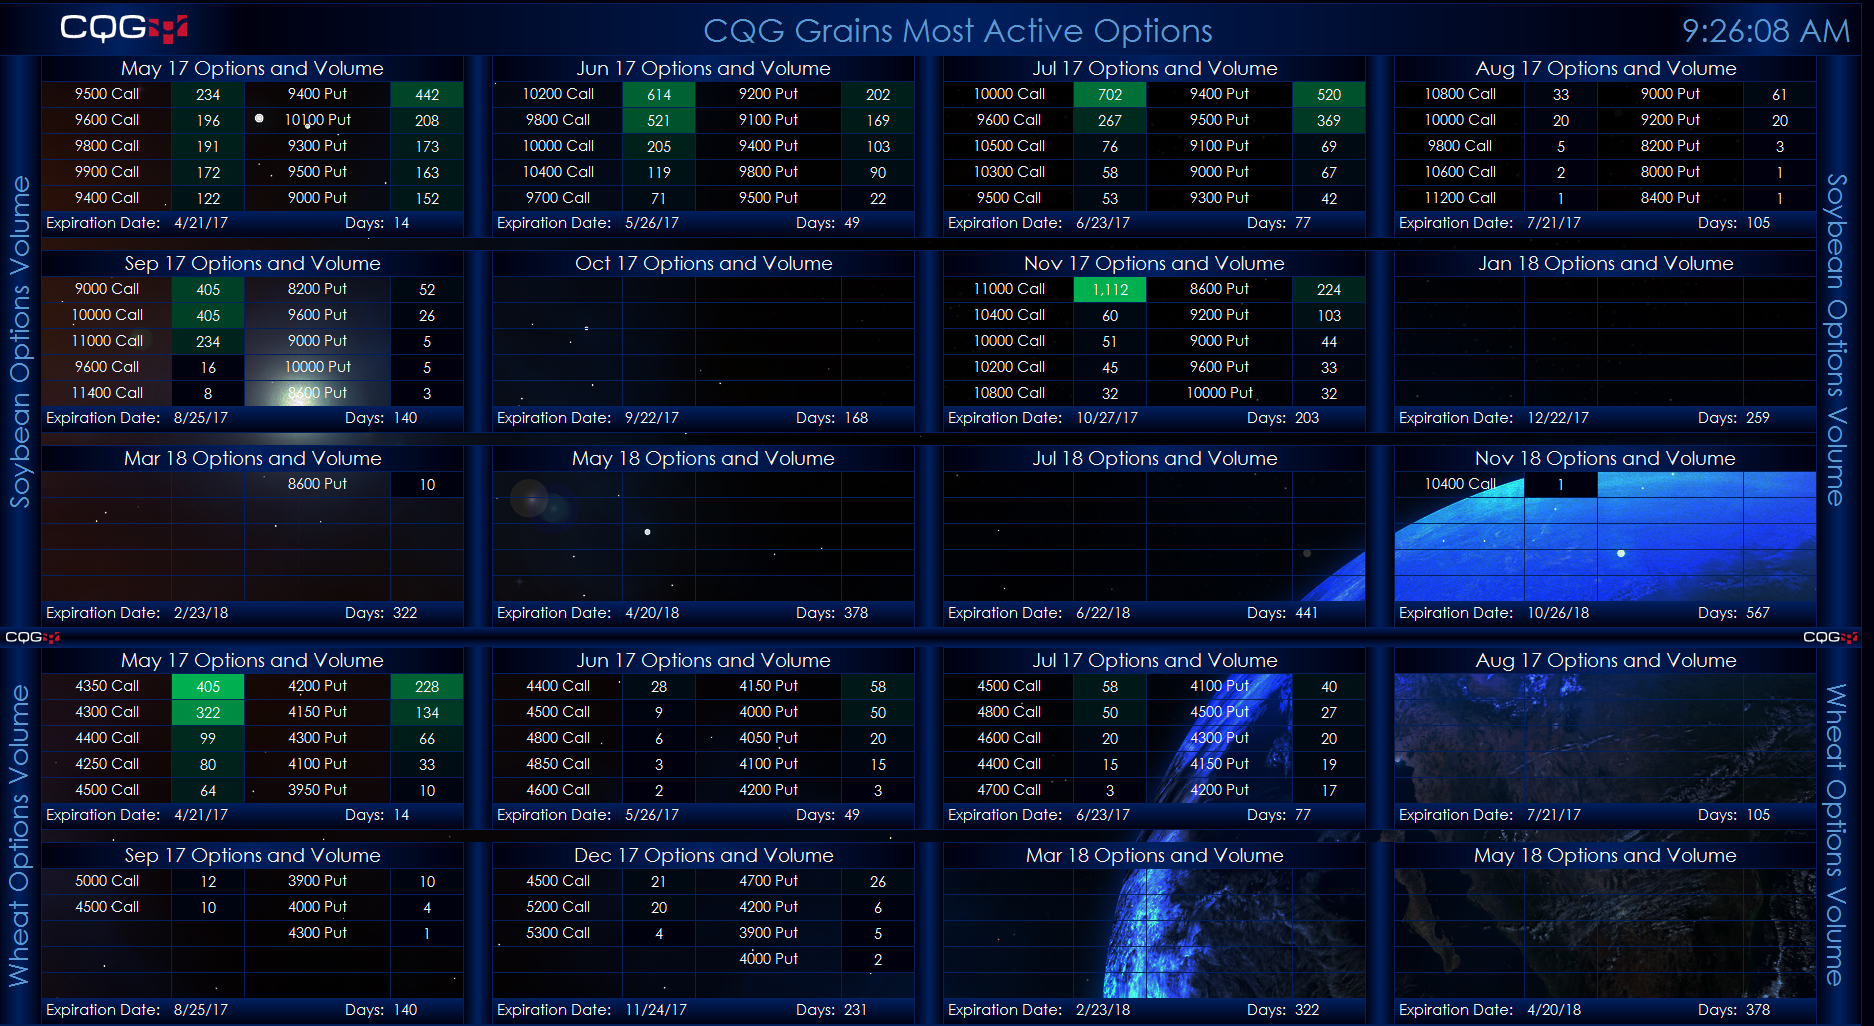
This Microsoft Excel® dashboard scans the options on soybeans, wheat, and corn (Globex) futures markets for volume. It displays strikes ranked by the volume traded for each expiry listed… more
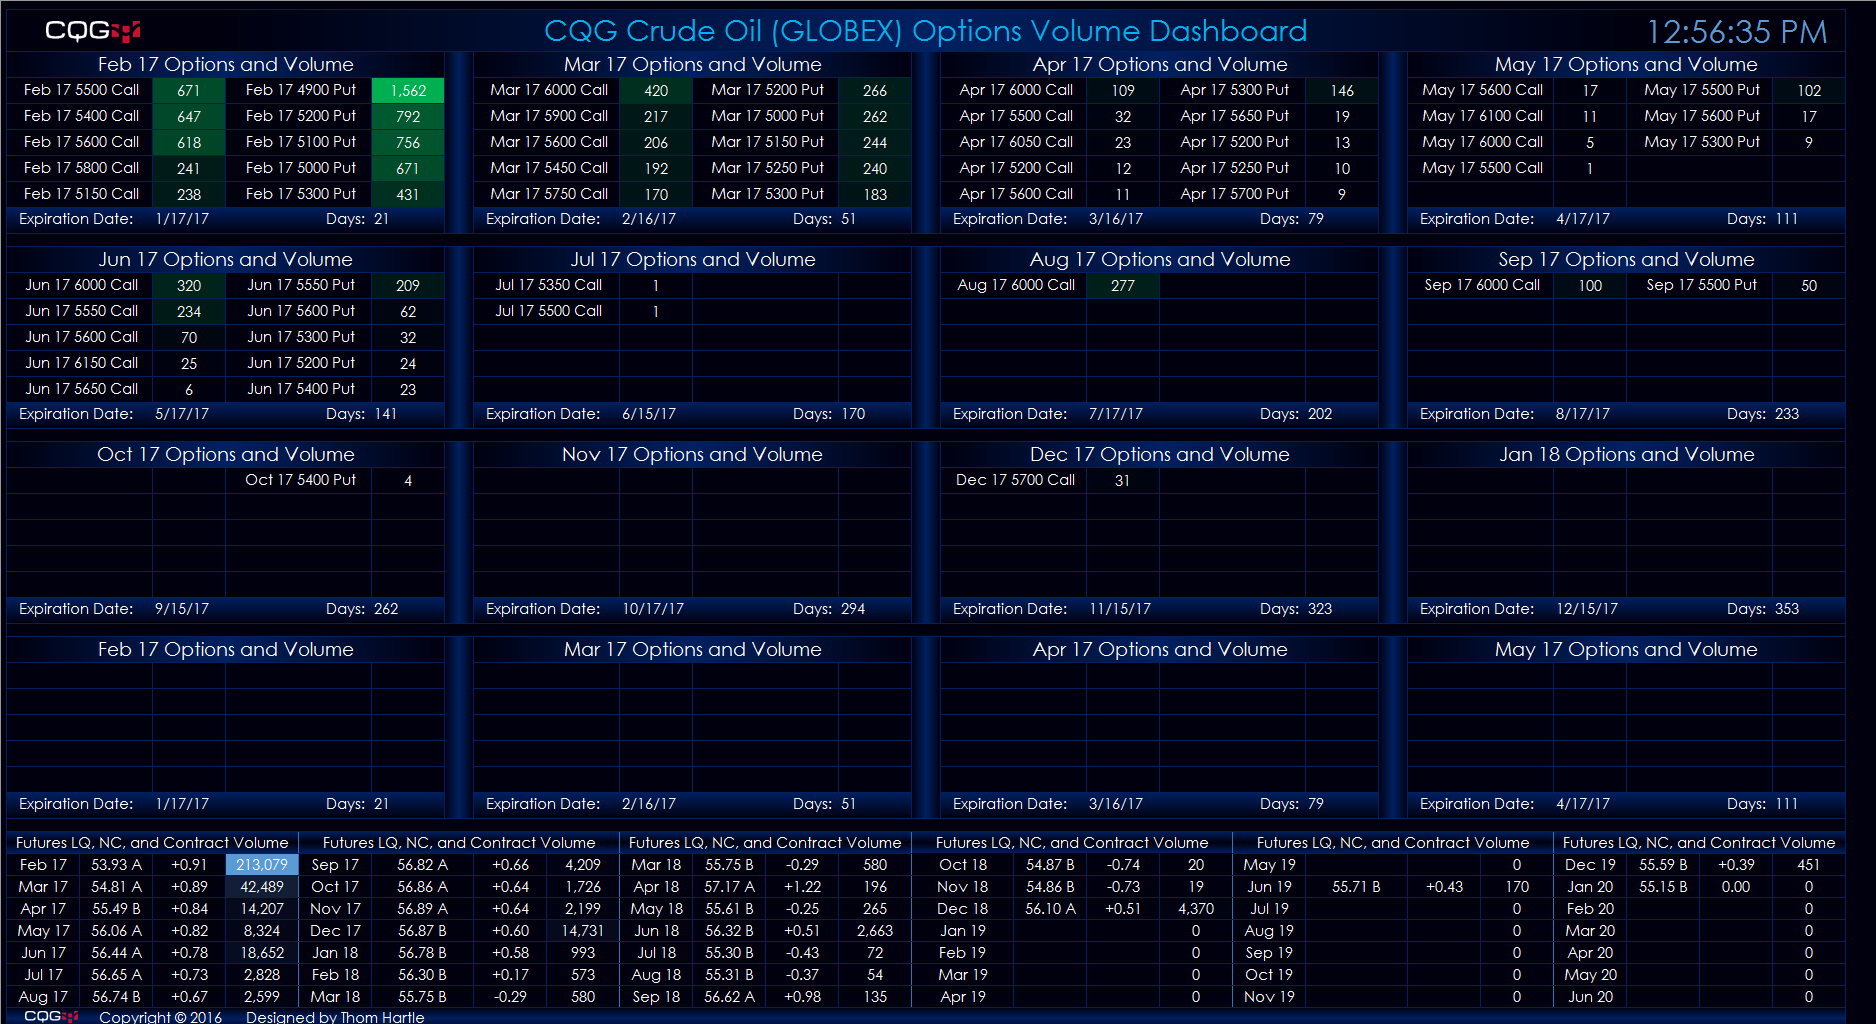
This Microsoft Excel® dashboard scans the crude oil (GLOBEX) futures market options for volume and ranks the traded volume for each expiry out to sixteen months. The scan covers options… more
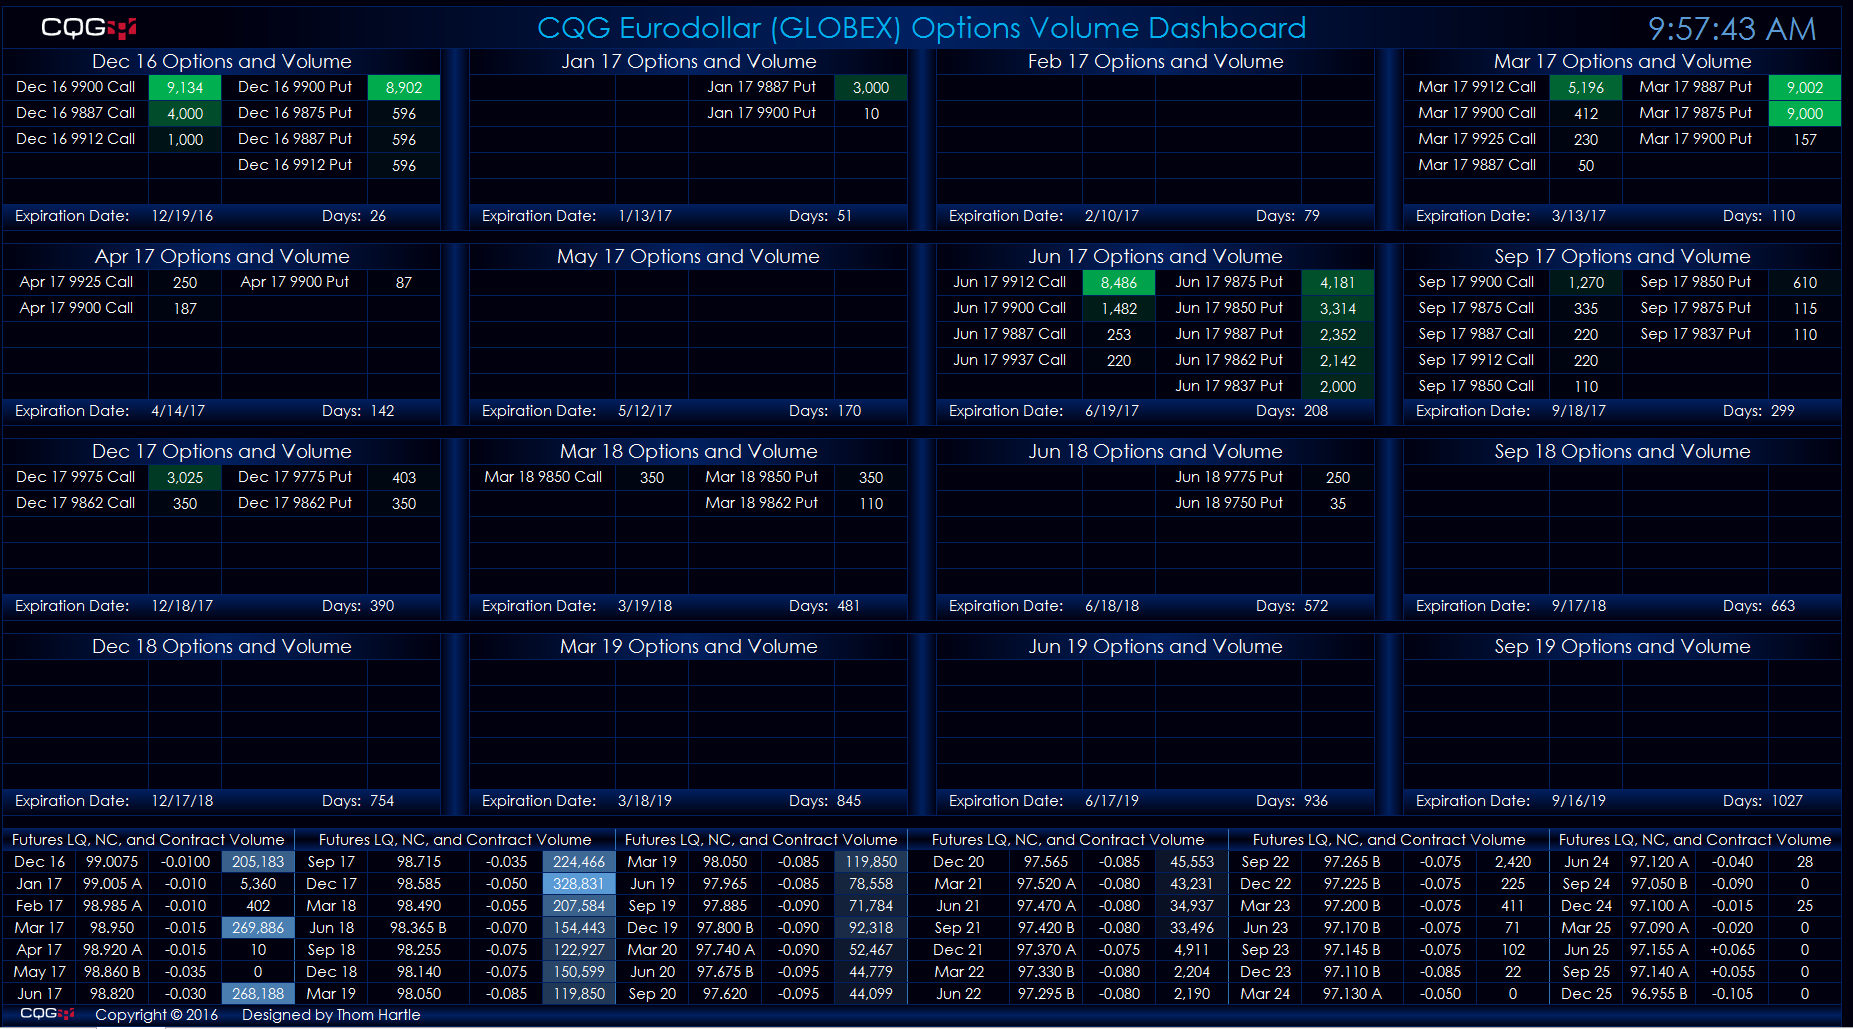
This Microsoft Excel® dashboard scans the options on the Eurodollar futures market for volume and ranks the traded volume for each expiry out to three years. The scan covers options traded ten… more
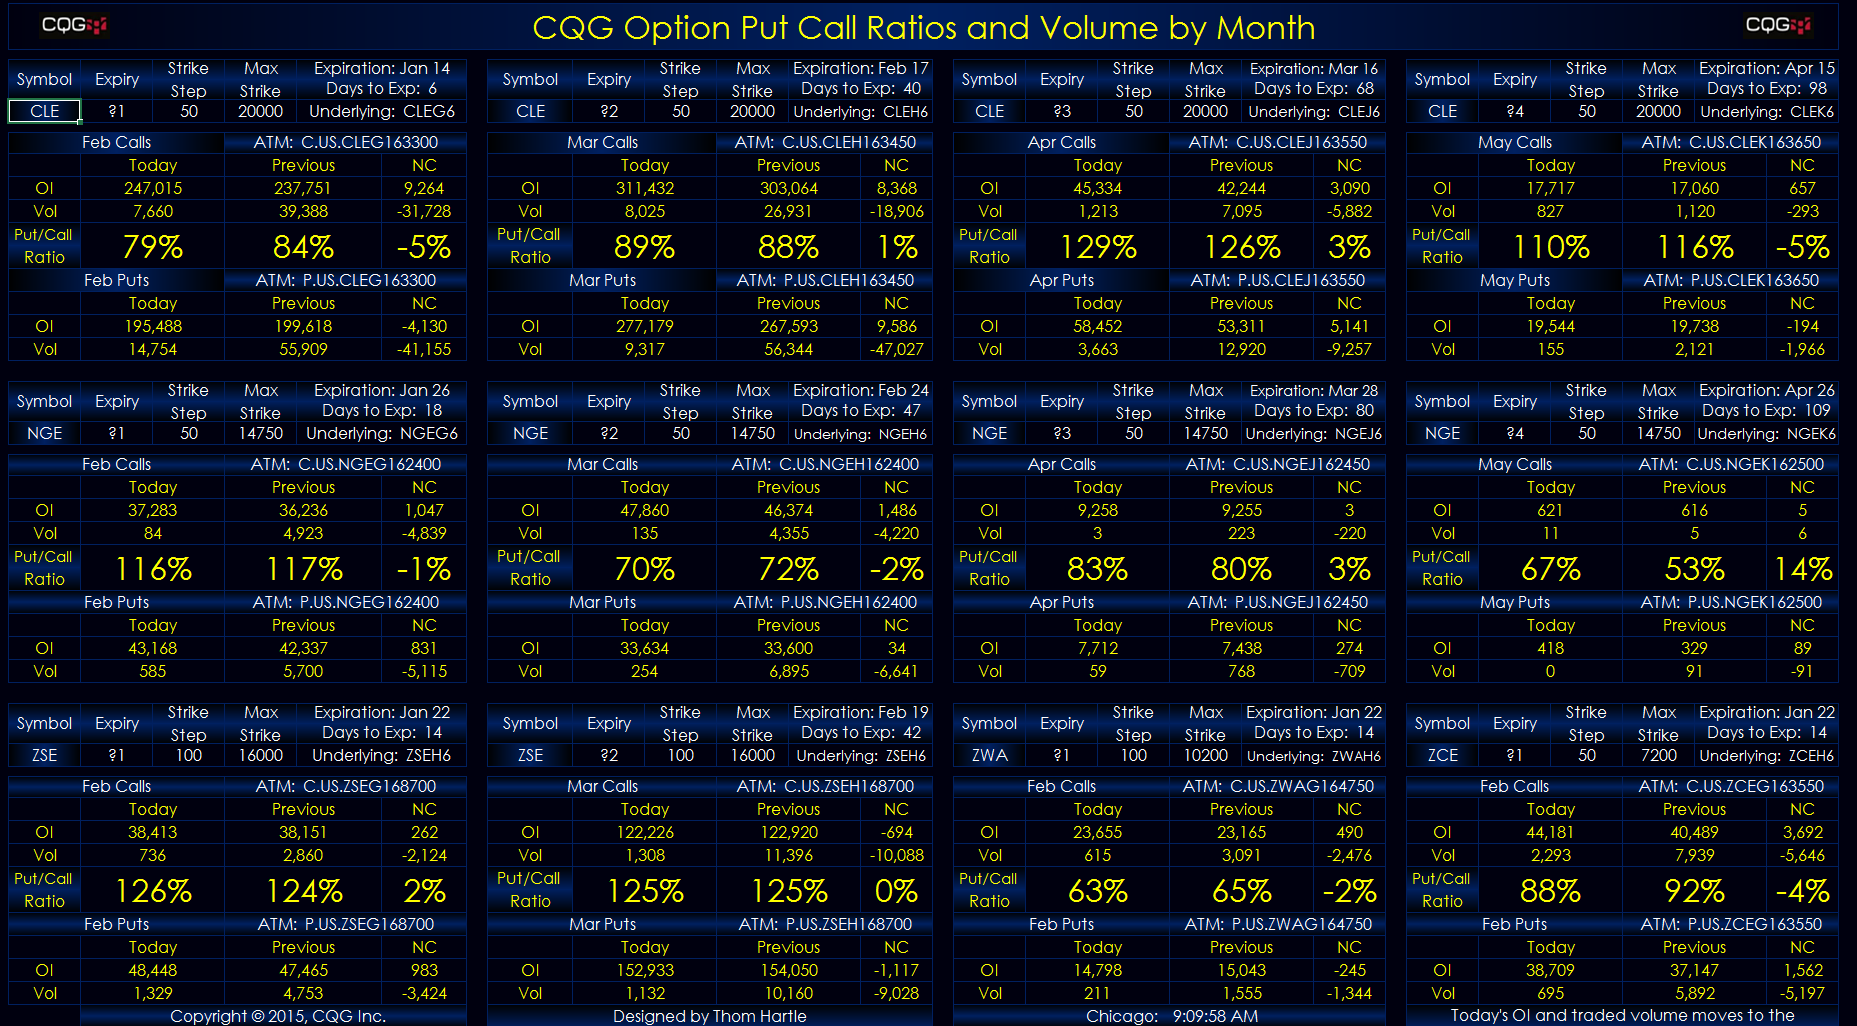
This Microsoft Excel® dashboard displays today’s open interest and traded volume for all of the strikes by month for both call and put options on futures. In addition, the current put/call ratio… more