Microsoft Excel's PROPER Function simply "Capitalizes the first letter in a text string and any other letters in text that follow any character other than a letter. Converts all other letters to lowercase letters." The function is:
=PROPER(Text)
CQG IC and QTrader users who connect to Excel using RTD functions for market dashboards can use the PROPER Function to build a cleaner looking display of maret data.
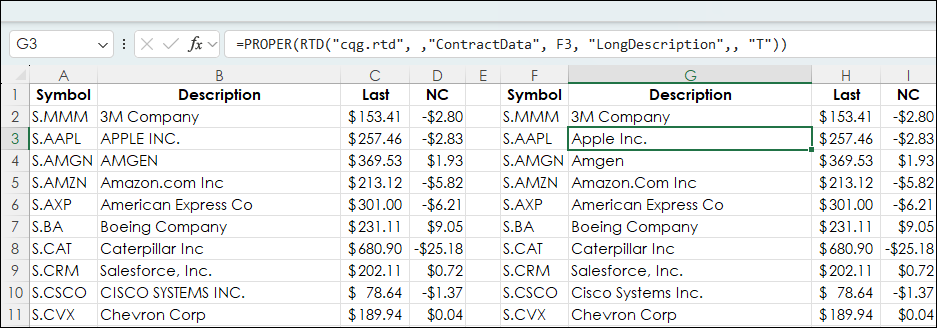
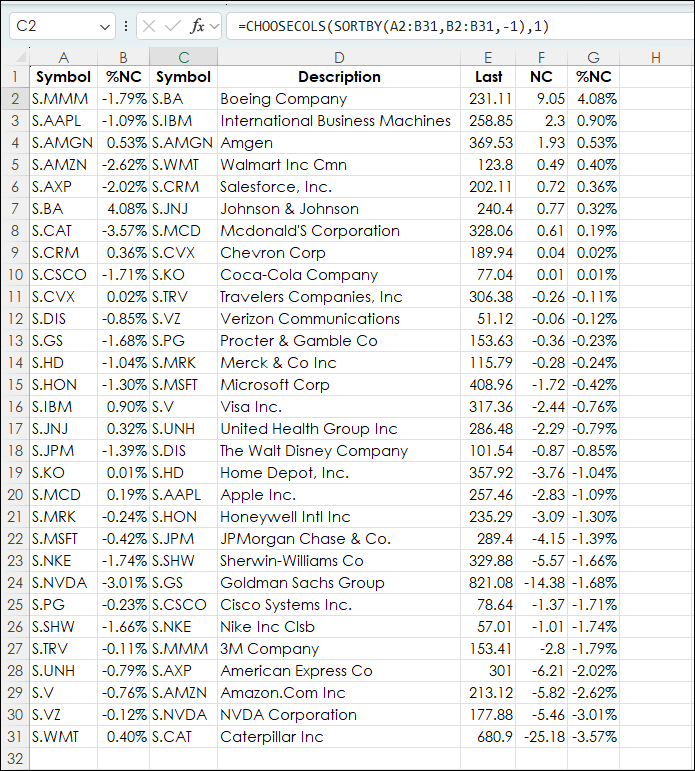
For example, this image displays in column B the long description for companies in the Dow Jones Industrial Average. Some are all capital letters. Column G uses the Proper Function and alleviates the inconsistencies.
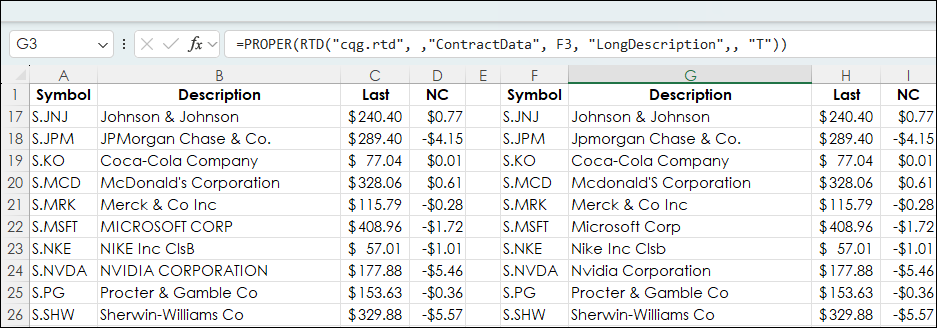
However, there are "edge cases" where the Proper Function creates an issue. For example, the long description for S.JPM is "JPMorgan Chase & Co" and when the Proper Function is used the description becomes "Jpmorgan Chase & Co". Similarly, S.NVDA long description is "NVIDIA CORPORATION" and when the Proper Function is used the description becomes "Nvidia Corporation."
To deal with these Edge Cases the IFS function is used. The IFS function checks whether one or more conditions are met and returns a value that corresponds to the first TRUE condition. The two symbols return an accurate description. This is the function:
=IFERROR(IFS(F18="S.JPM","JPMorgan Chase & Co.",F18="S. NVDA","NVDA Corporation"),PROPER(RTD("cqg.rtd",,"ContractData",F18,"LongDescription",,"T")))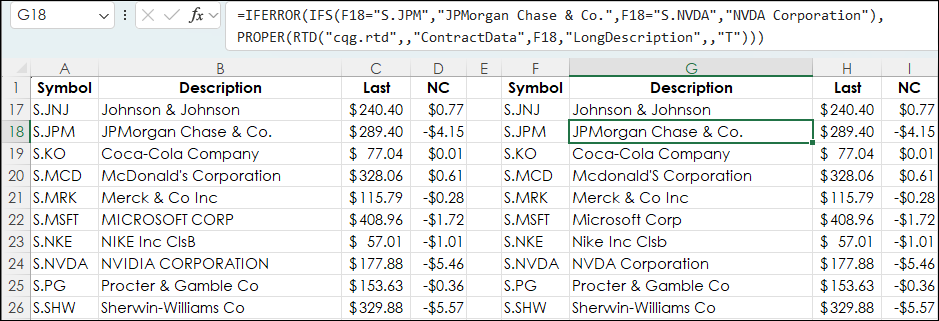
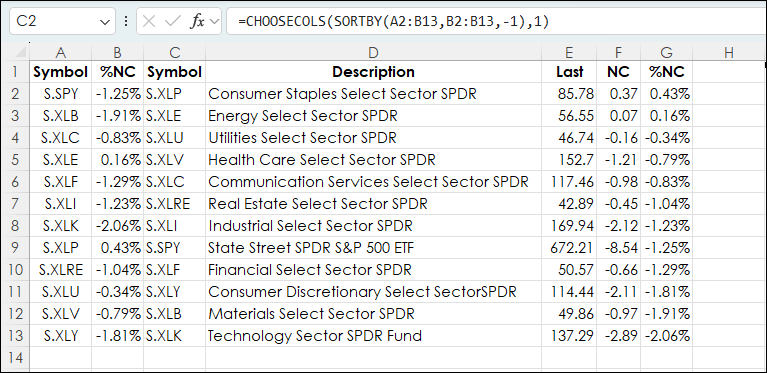
Another edge case is if the symbol is a SPDR (Standard & Poor's Depositary Receipt) such as for symbol S.XLRE the long description is "Real Estate Select Sector SPDR" but the Proper function returns "Real Estate Select Sector Spdr."
The following function checks the description for "SPDR" and if it is there it returns the description "Real Estate Select Sector SPDR" instead of "Real Estate Select Sector Spdr".
=IF(ISERROR(FIND("SPDR",RTD("cqg.rtd", ,"ContractData", C2, "LongDescription",, "T"))),PROPER(RTD("cqg.rtd", ,"ContractData", C2, "LongDescription",, "T")),RTD("cqg.rtd", ,"ContractData", C2, "LongDescription",, "T"))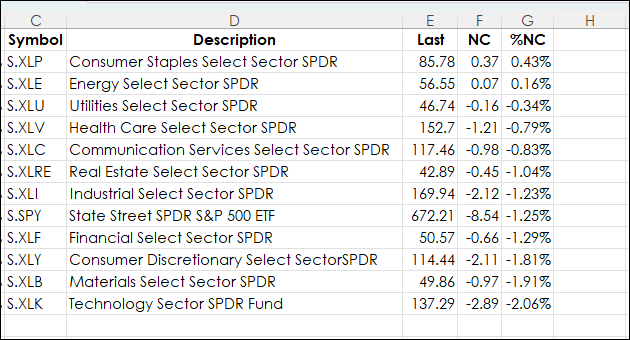
One solution would be to simply hard code all the descriptions. However, the sample dashboard has three tabs" DJIA, Sectors, and NASDAQ 100. Each tab is sorting the symbols by percent net change in Column C. The technique is detailed in "Excel Combining SORTBY, CHOOSECOLS, and TAKE Functions".
=CHOOSECOLS(SORTBY(A2:B31,B2:B31,-1),1)
Using functions that could deal with the dynamic sorting of symbols was required.
The image below is the DJIA tab.
The image below is the Sectors tab.
The image below is the NASDAQ 100 tab.

The Description columns are using a combined version of Proper Functions. The Edge Cases functions were expanded for the NASDAQ 100 symbols where the Proper Function returned an undesirable description.
Each tab has a URL for a source of the symbols used.
The purpose of this article was to demonstrate how to use the Proper Function to design more consistent looking Excel dashboards.
Requirements: CQG Integrated Client or QTrader, and Excel 365 (locally installed, not in the Cloud) or more recent.