
This dashboard tracks the spread between the two volatility futures contracts, including the forward curves.
Please install the CQGVIXVSTOXX component pac before running the… more
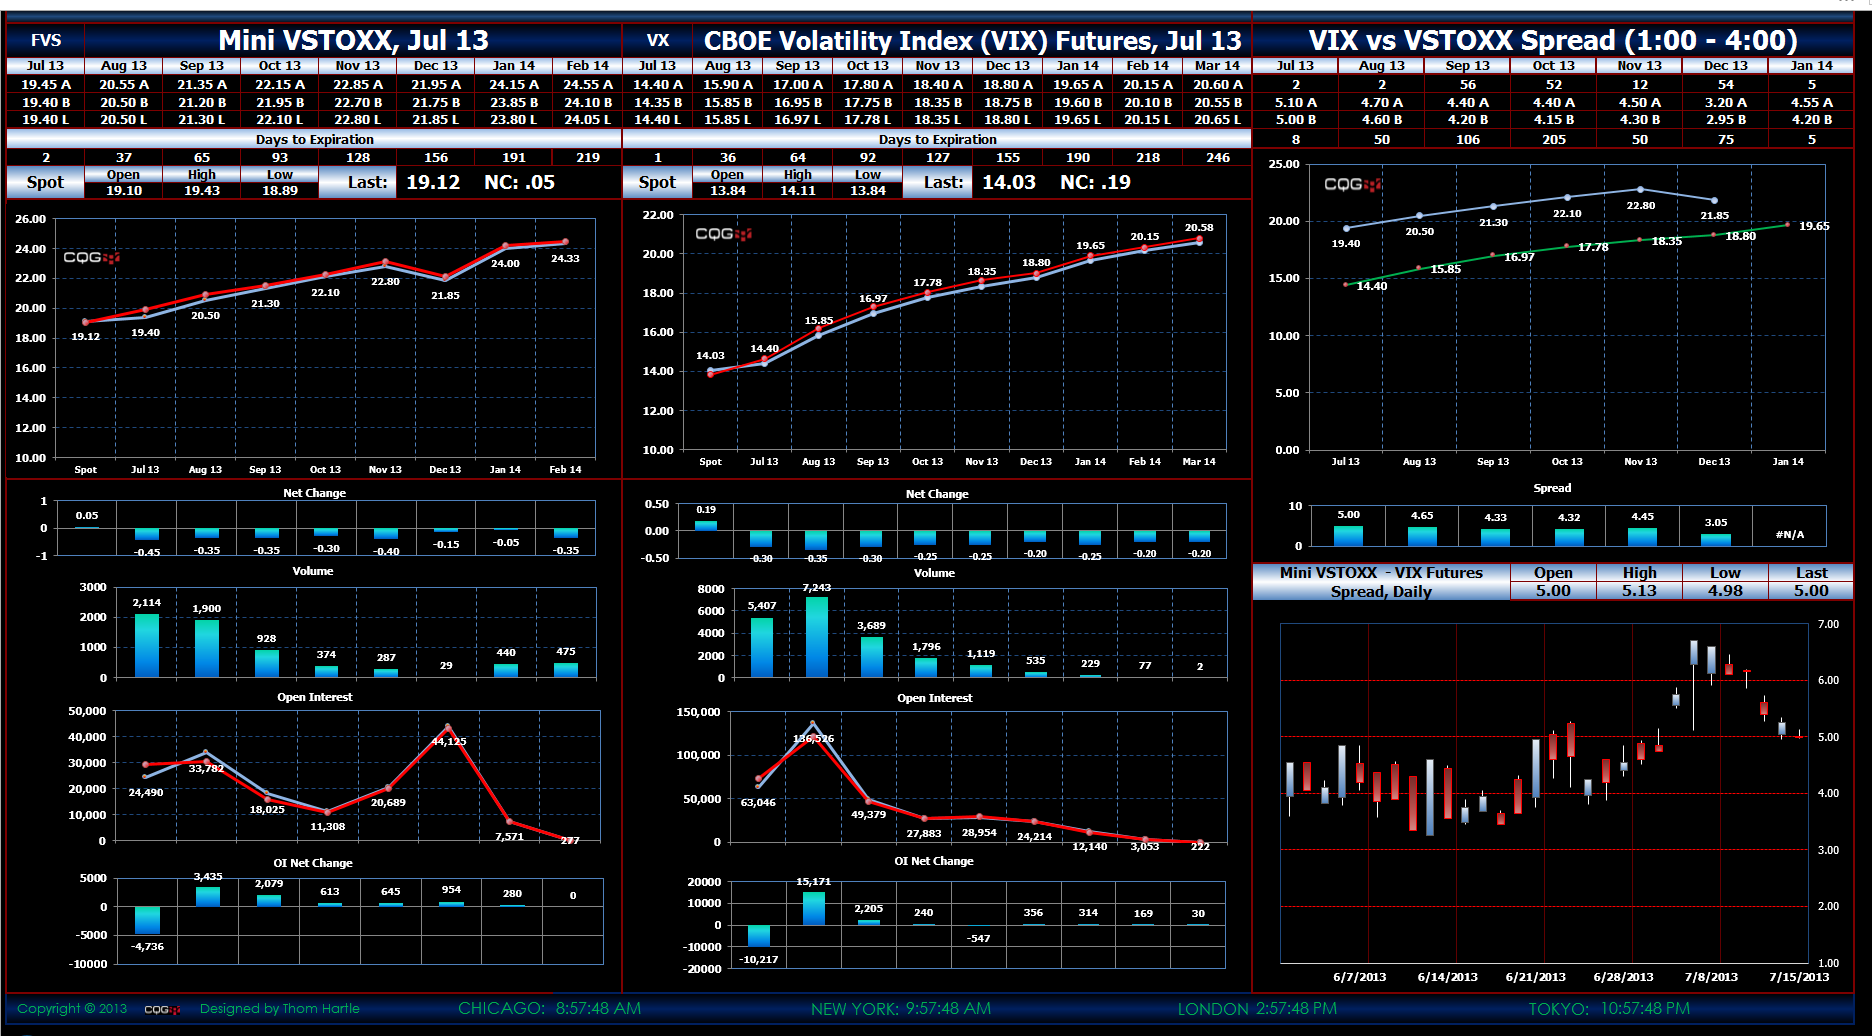
This dashboard tracks the spread between the two volatility futures contracts, including the forward curves.
Please install the CQGVIXVSTOXX component pac before running the… more
In this informative webinar, Thom Hartle, CQG Director of Product Training, shows you how to build professional CQG-powered Excel dashboards that allow you to simplify your workflow.
… more
Denver, CO and Chicago, IL, July 17, 2013 - Continuum and CQG, Inc. today announced the addition of foreign exchange trade execution to its services through integration with KCG Hotspot, the award… more
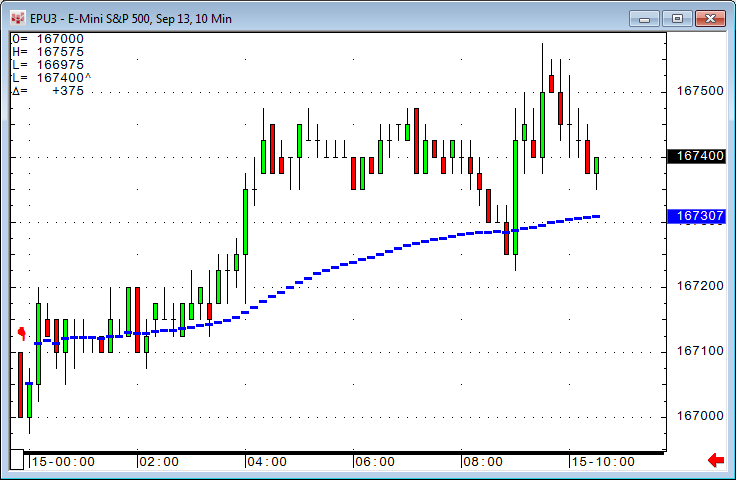
Here are some thoughts about extracting "daily" values inside an intraday market.
A common request is to calculate and plot a "daily close" value of a study based on an intraday time frame… more
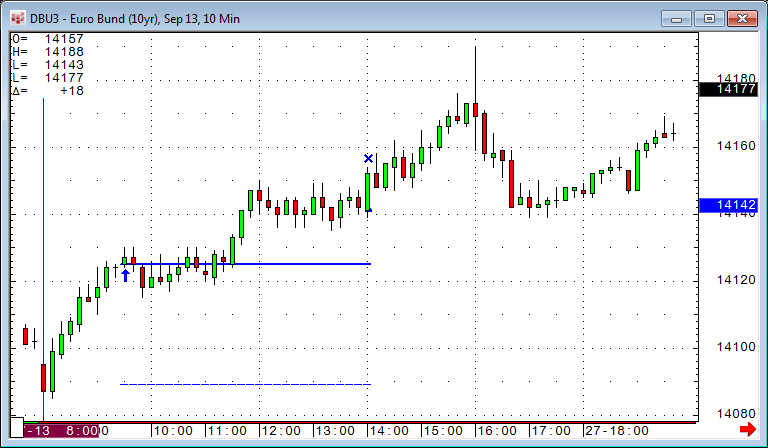
When it comes to coding your trading systems, allowing only one trade per day is by far the most frequent request.
In the example above, the session starts at 8:00 local time (see… more
Watch Arthur Maddock, Managing Director of Portara, demonstrate how to roll, compress, and chart data from CQG's database.
Maddock demonstrates how to:
Customize roll settings to… more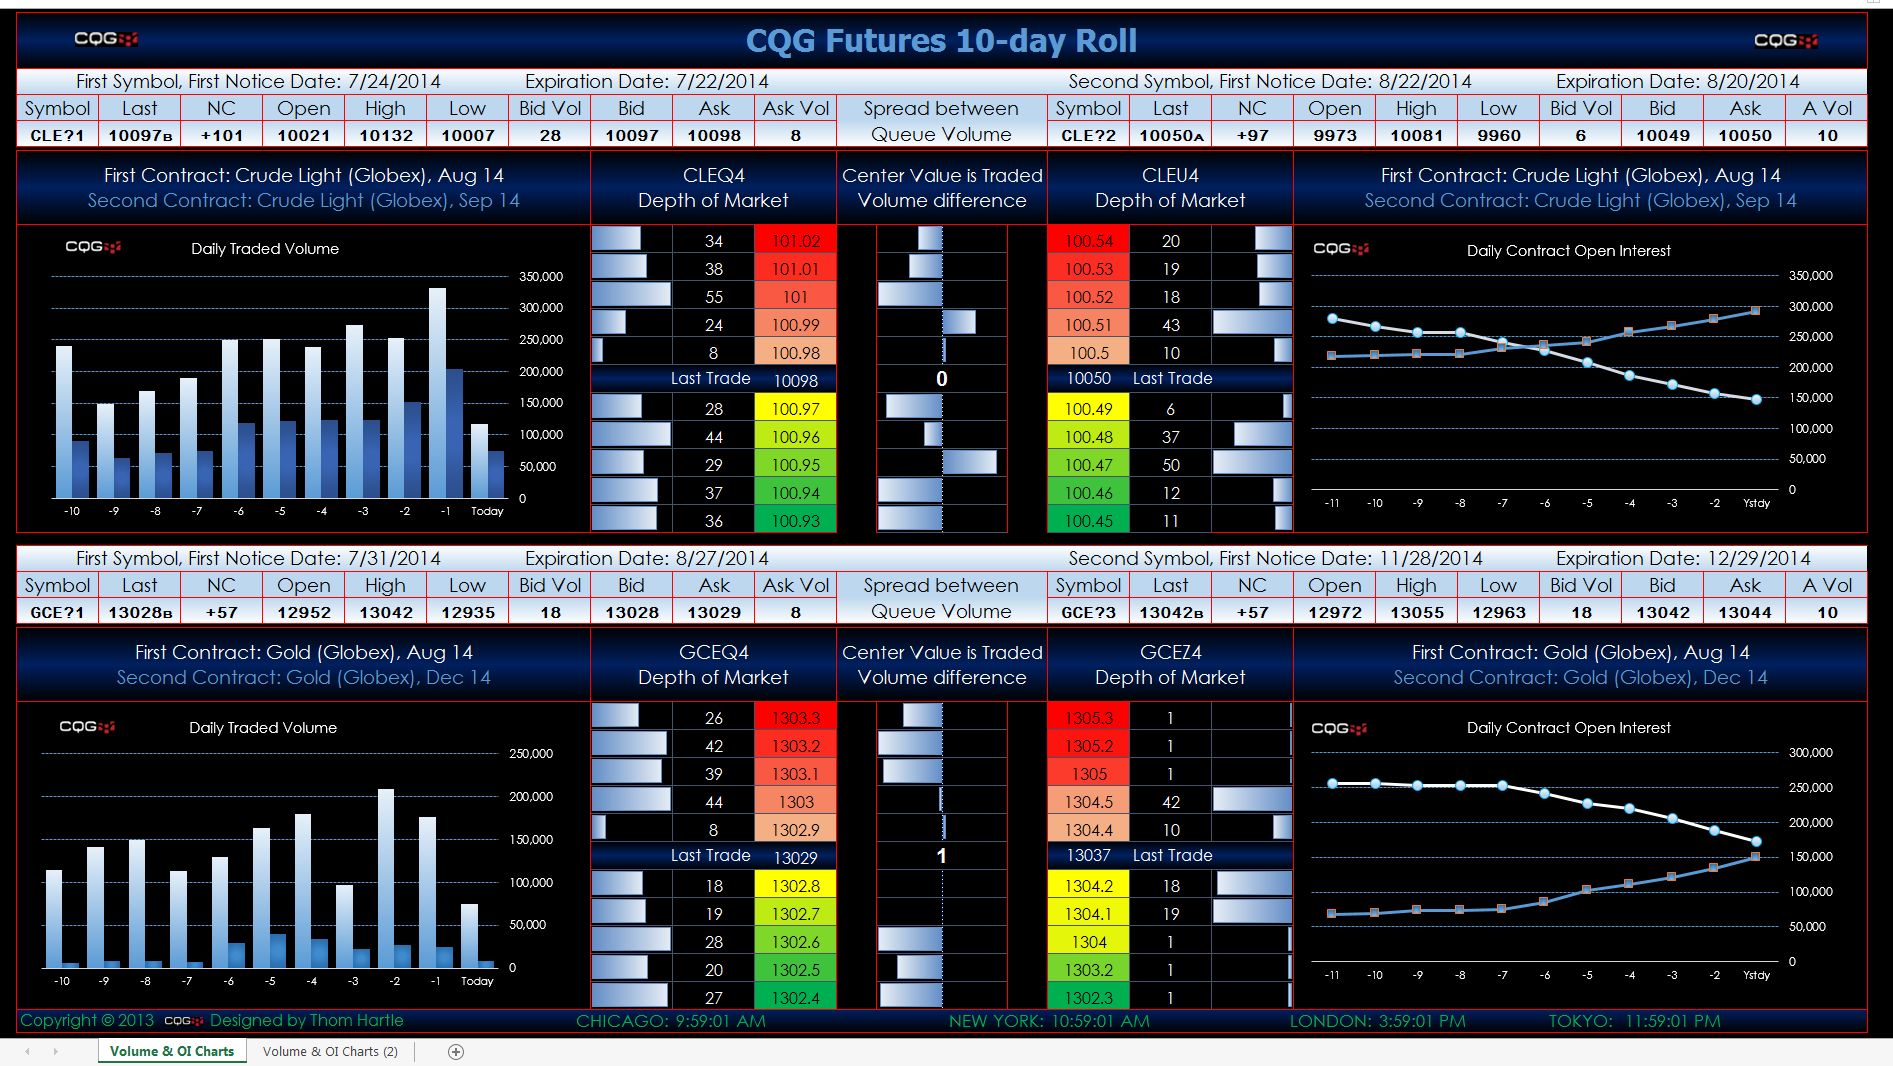
Track the roll between futures contracts using this dashboard. The daily volume is displayed side-by-side on the volume chart and the open interest values are displayed as overlaid line charts.… more
Watch Tom Alexander, CEO of Alexander Trading, outline his auction market trading foundation model in CQG Integrated Client.
He explains how this model can be powerful for any trading… more
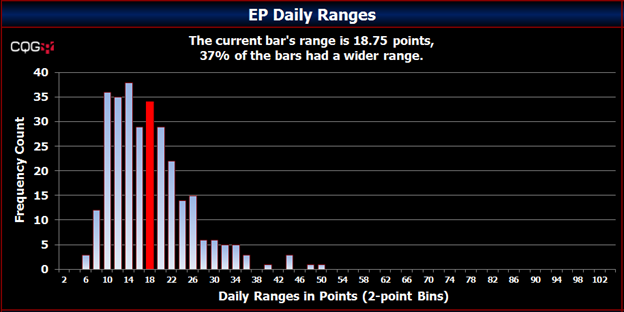
Frequency distribution is simply how often a value appears within a group of values. For example, a group of values is a range from 1 to 5. The collection of numbers is 1, 3, 1, 2, 3, 4, 1, and 4… more
This interview is part of a series of interviews with traders who use CQG Integrated Client. The goal of these interviews is to illustrate why traders who begin using CQG tend to continue using… more