Here are some thoughts about extracting "daily" values inside an intraday market.
A common request is to calculate and plot a "daily close" value of a study based on an intraday time frame, such as five-minute bar data. With CQG this is fairly simple. Just force the moving average code in the toolbox to daily by adding ",D" at the end:
MAx1(@,Sim,5),D
As long as today's session is active, it uses the current bar's close (i.e. last price) of today to calculate the average; therefore the value will update during the session. However, the moving average line is plotted one bar forward because we do not know the final value before the session ends.

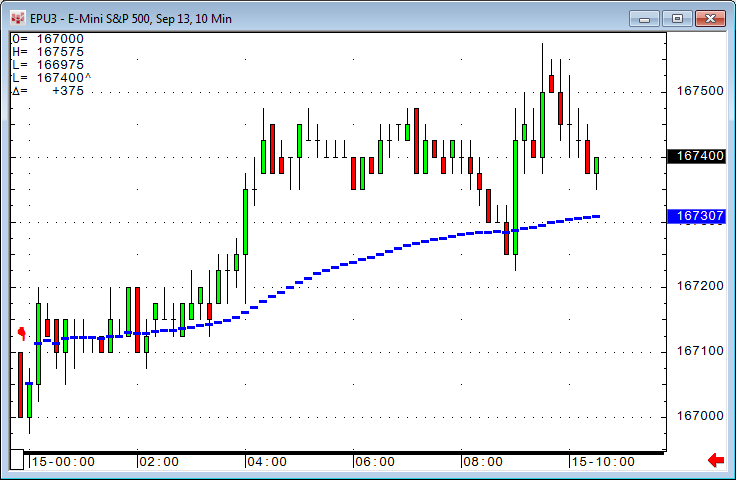
This value is safe to use inside a trading system. With a little trick we can force the code to plot everything adjusted by one day to the left. Just add "[1]" before the ",D":
MAx1(@,Sim,5)[1],D
Because we are plotting something in today's chart area based on information we do not have before the end of the session, this should not be used in a trading system.
The red line is what we had before, but now with the "[1]" we are adjusting the moving average data to the left (blue line).
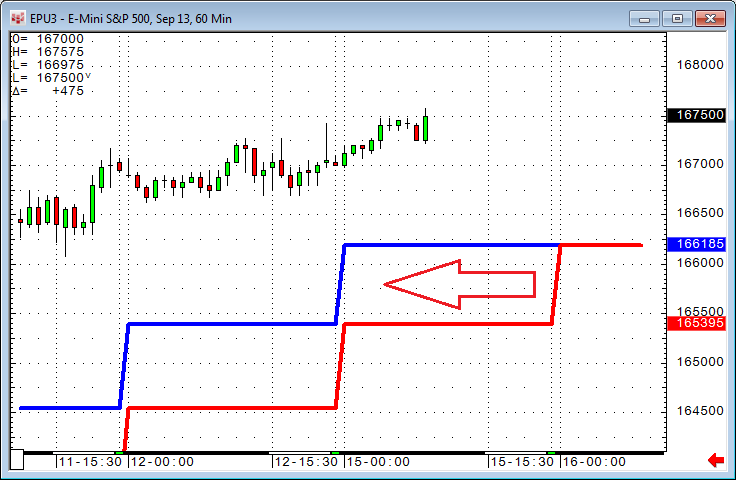
Another example of intraday information is the development of today's highs and lows during the day, and today's pivot line derived from that information.

The green line references today's high; the red line today's low; and the blue line is today's high plus today's low plus the current candle's close divided by three.
Here is the code:
- High:
Maxper(High(@), BarsSince( BarIx(@,EndOfDay)=0,1,1500))
- Low:
Minper( Low(@),BarsSince( BarIx(@,EndOfDay)=0,1,1500))
- Pivot:
(Maxper(High(@), BarsSince( BarIx(@,EndOfDay)=0,1,1500)) + Minper( Low(@),BarsSince( BarIx(@,EndOfDay)=0,1,1500)) + Close(@)) / 3
Maxper and Minper are undocumented functions that have not made it to the toolbox yet, but they can be used by just typing them into the code. The BarsSince function should look at least 1500 bars back to make sure it still works on a one-minute chart (sixty minutes times twenty-four hours equals 1440 bars). Bar since end of day starts counting with a zero, so the first bar of the day will always be bar number one.
The bonus code is a flexible-period moving average that progresses through the day. This requires a condition that marks the last bar of the day:
BarIx(@,EndOfDay)=0
In a custom study we accumulate the closes since the "last bar of yesterday" (i.e. including the first bar of today), and divide the result by the number of bars since end of day:
Accum(Close(@),B.LastBar(@))/ BarsSince( BarIx(@,EndOfDay)=0,1,1500)