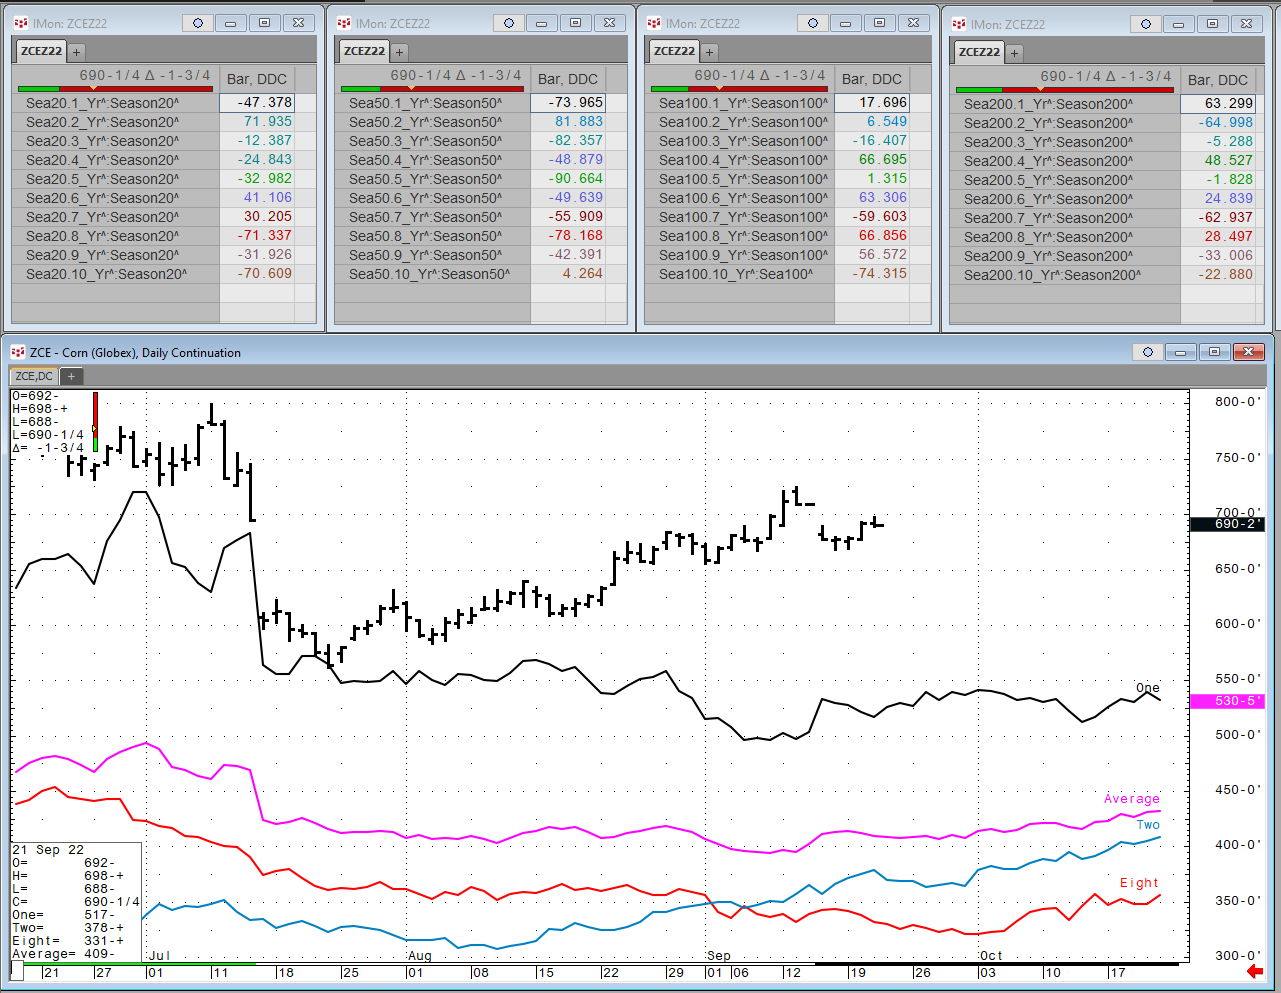
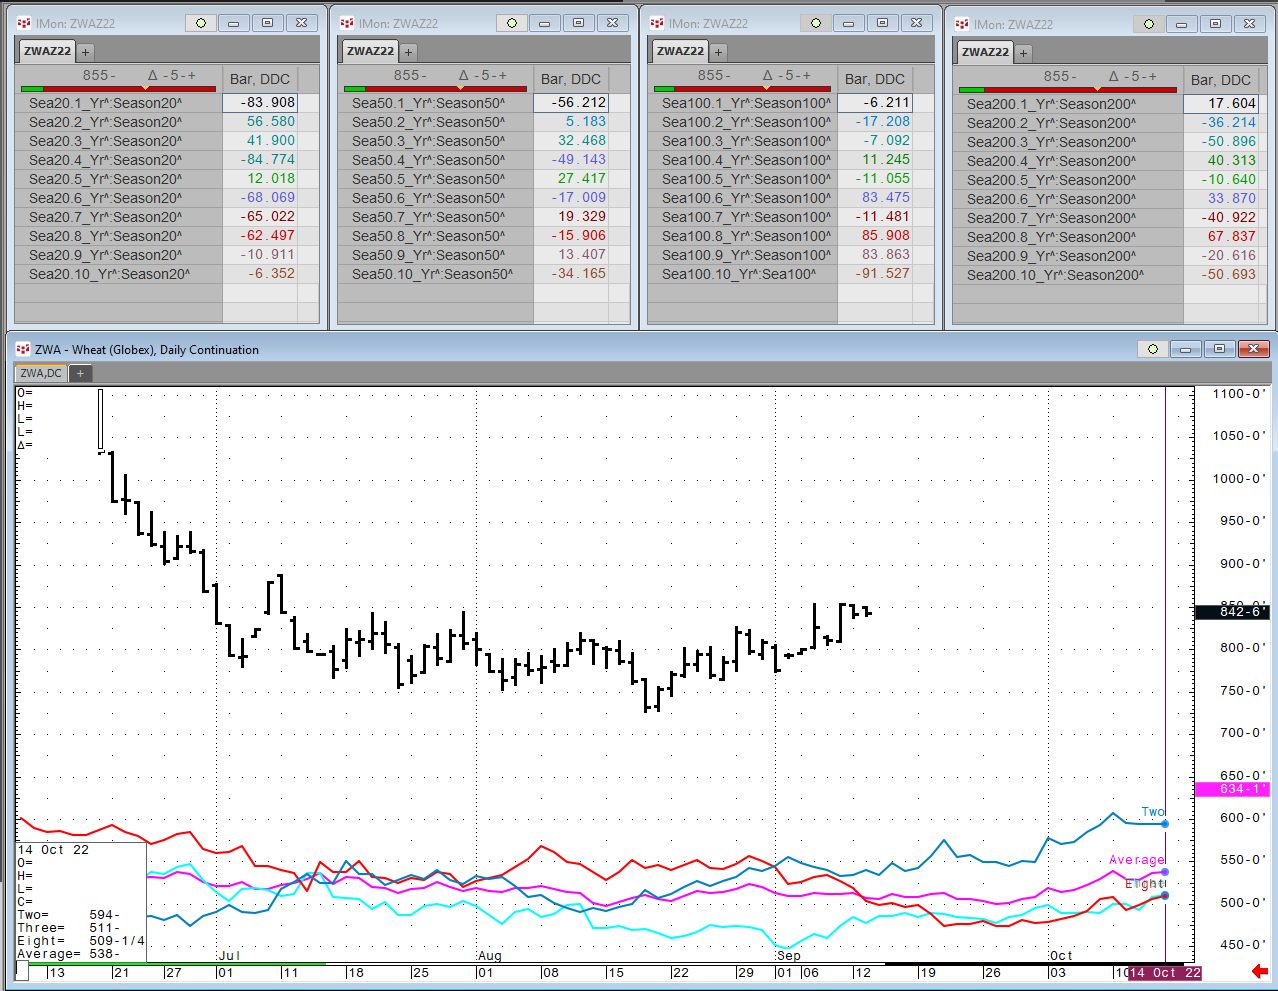
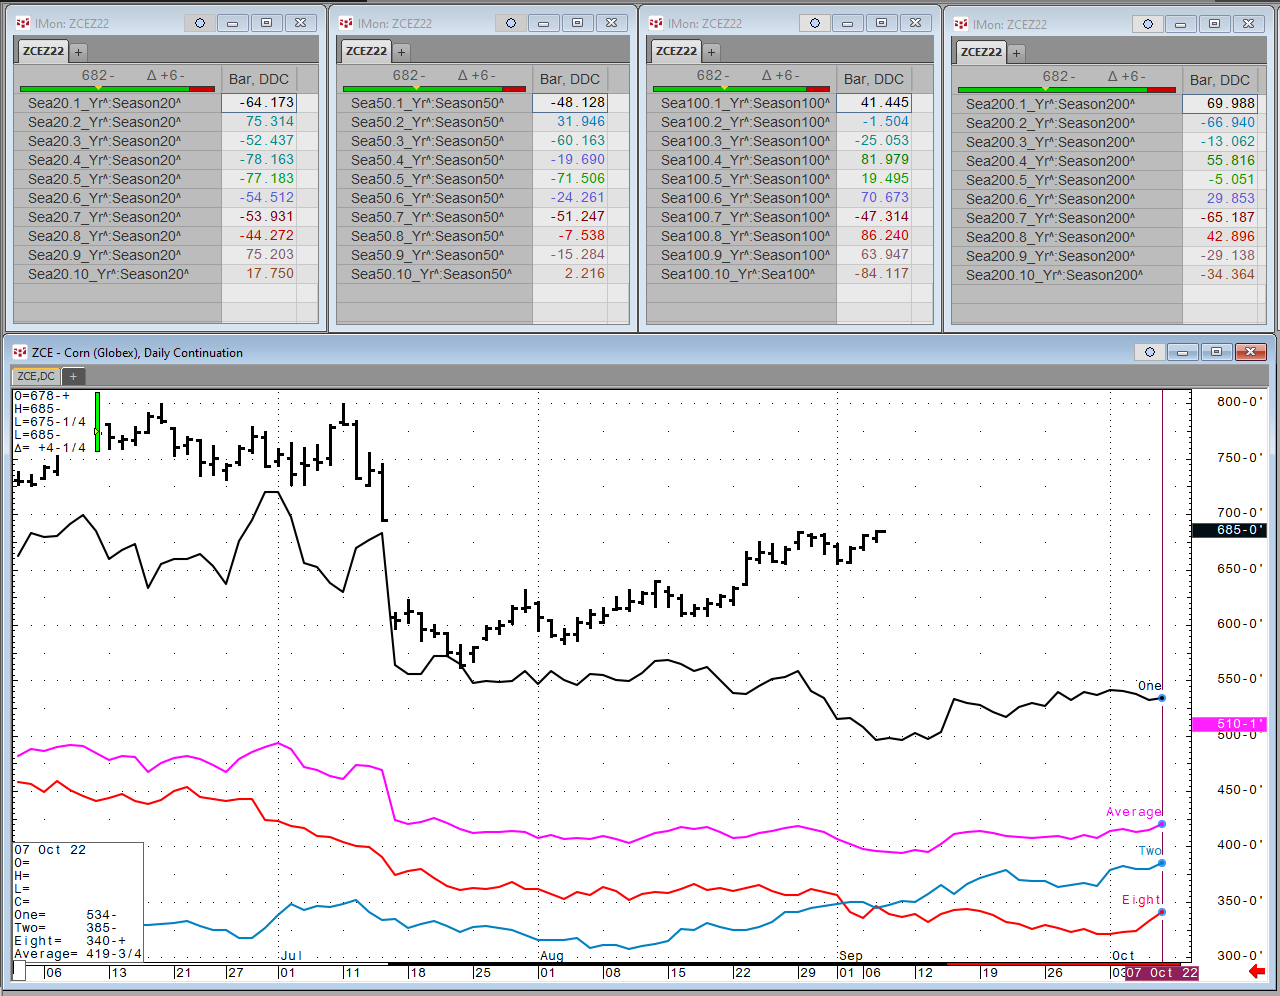
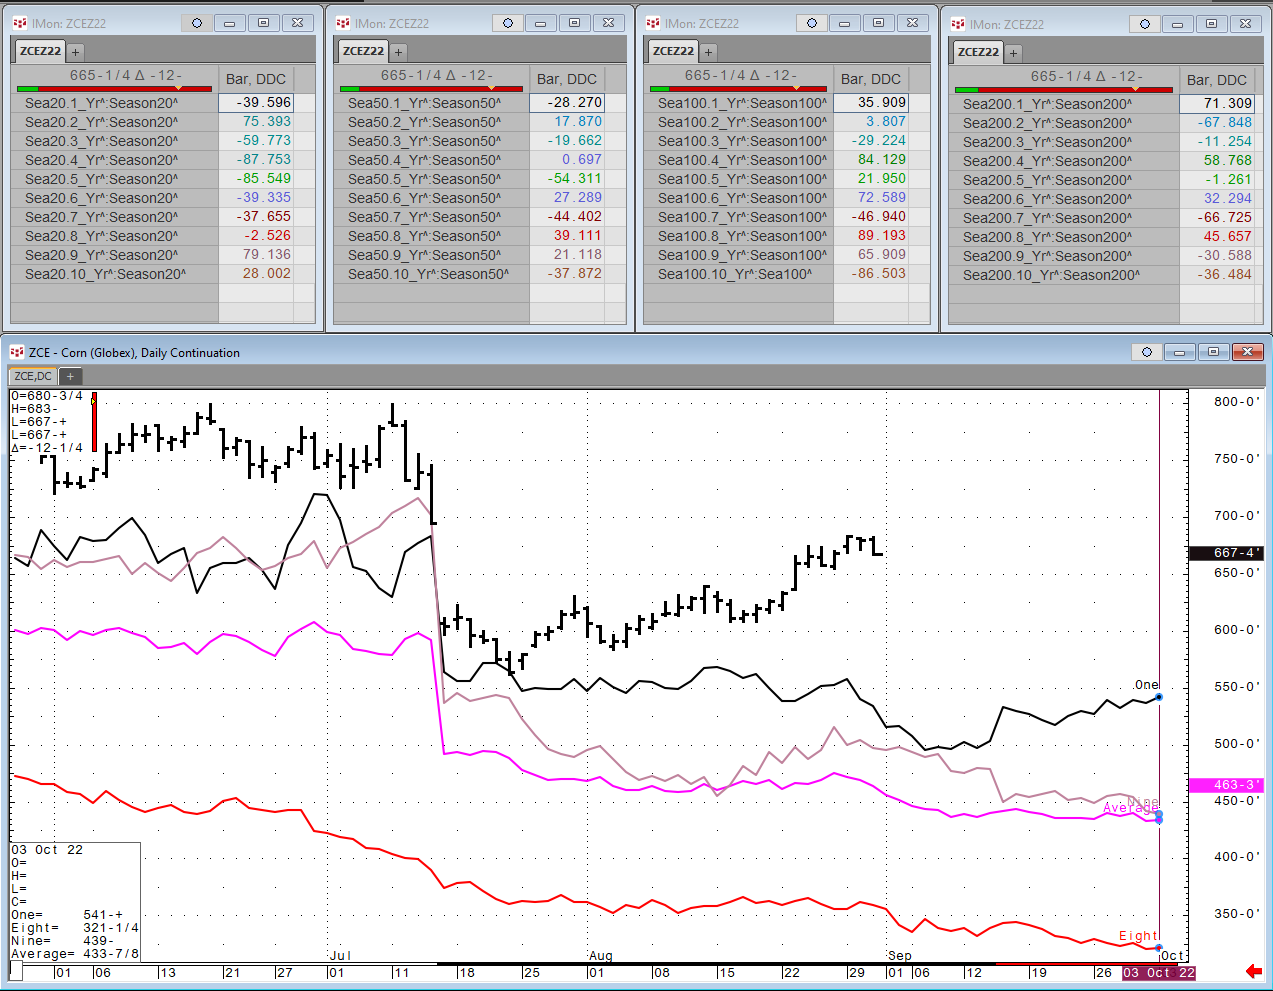
Each Wednesday this article will be updated with the current seasonal study using CQG’s Seasonal analysis applied to the Soybean, Wheat and Corn markets. You can download the CQG pac providing the… more
Each Wednesday this article will be updated with the current seasonal study using CQG’s Seasonal analysis applied to the Soybean, Wheat and Corn markets. You can download the CQG pac providing the… more
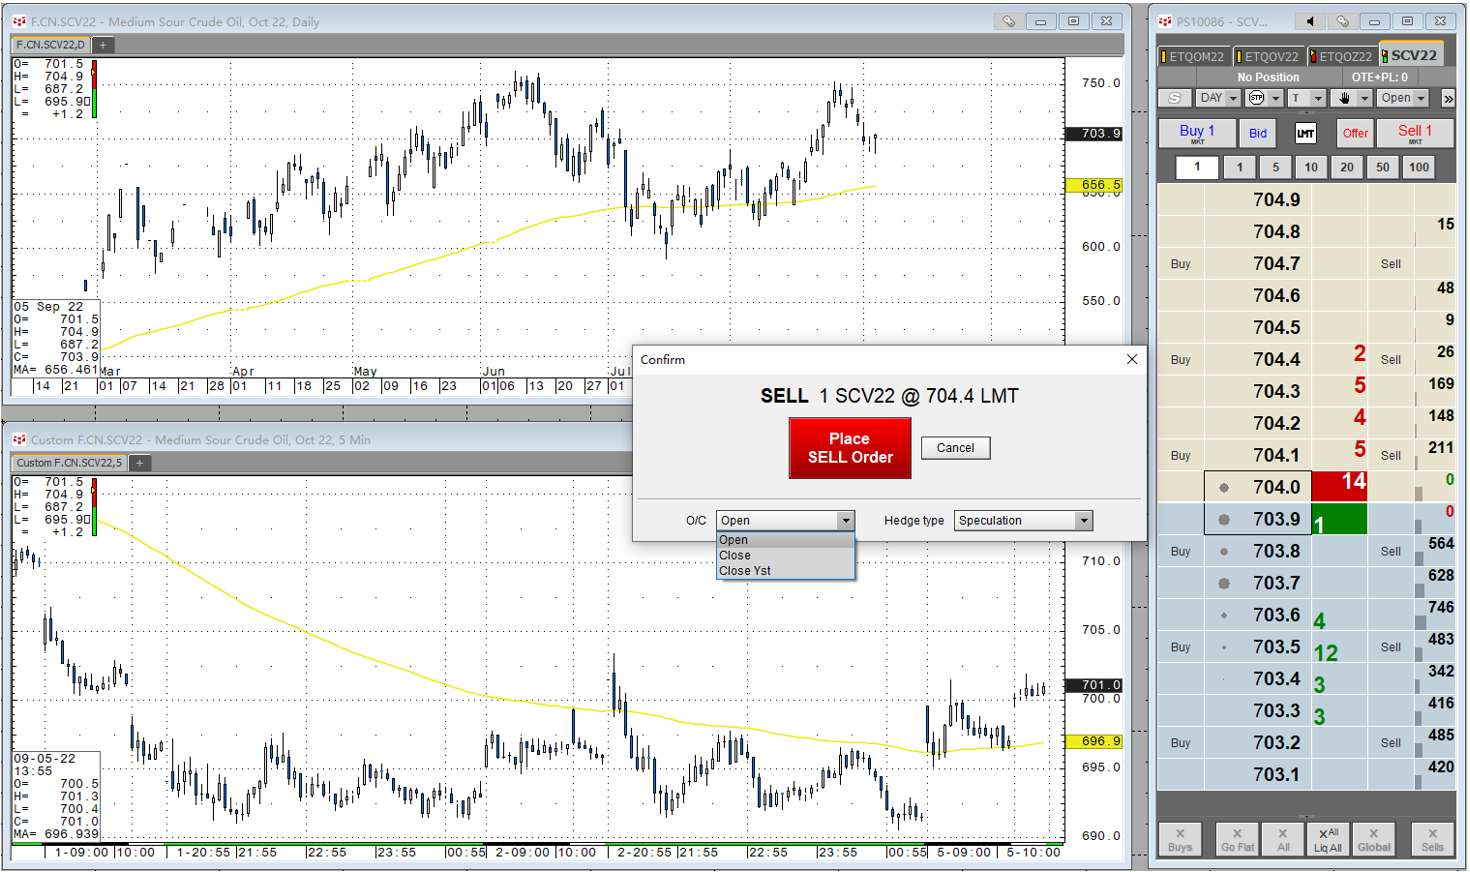
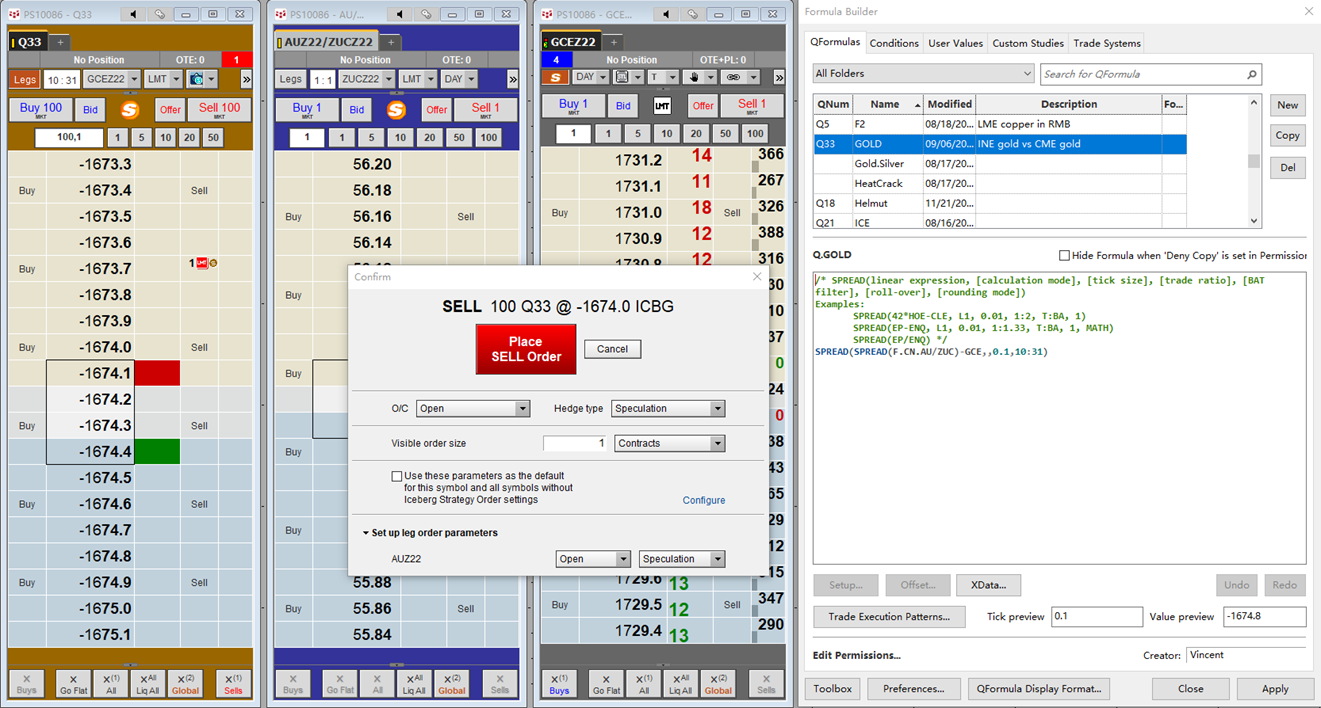
On September 2, 2022, Shanghai Futures Exchange (SHFE) announced approval for participation of Qualified Foreign Institutional Investors (QFII) and RMB Qualified Foreign Institutional Investors (… more
Shanghai Futures Exchange (SHFE) has announced approval for participation of Qualified Foreign Institutional Investors (QFII) and RMB Qualified Foreign Institutional Investors (RQFII) in commodity… more
Each Wednesday this article will be updated with the current seasonal study using CQG’s Seasonal analysis applied to the Soybean, Wheat and Corn markets. You can download the CQG pac providing the… more
Seasonality can be a significant factor for markets across all asset classes as it creates expectations and shapes sentiment. Markets move higher or lower when buyers dominate sellers or sellers… more
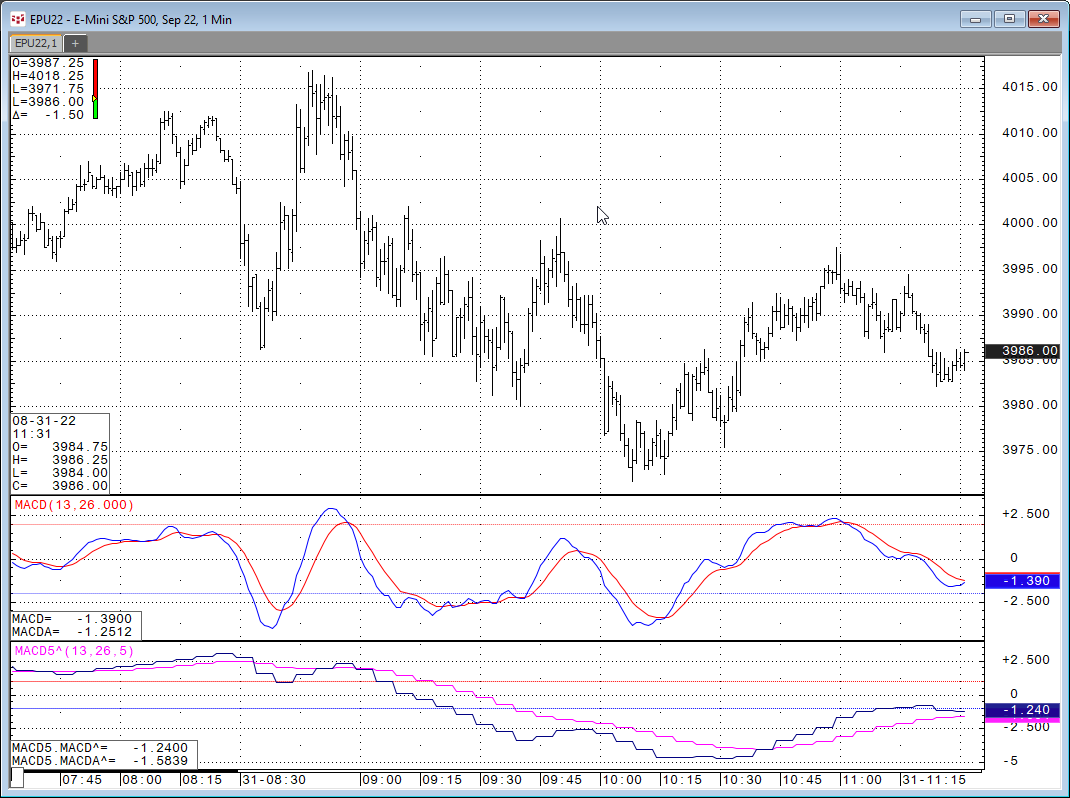
Let's say you want to look at a study on a chart but you want the study to use a different time frame than the time frame for the bars. For example, the MACD Study on a 1-minute chart using 5-… more
Each Wednesday this article will be updated with the current seasonal study using CQG’s Seasonal analysis applied to the Soybean, Wheat and Corn markets. You can download the CQG pac providing the… more
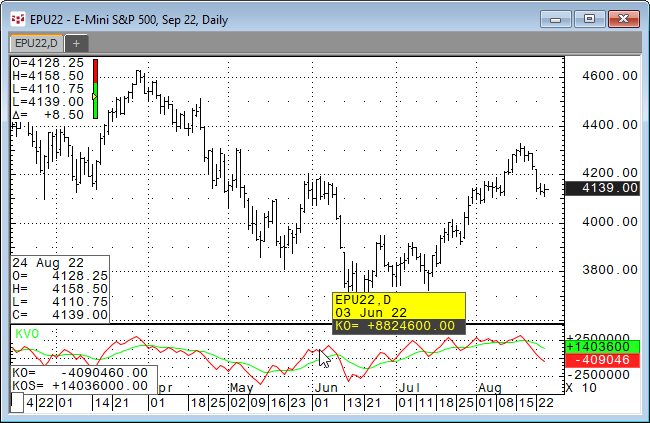
The Klinger Volume Oscillator was developed by Stephen Klinger. The study uses the difference between two exponential smoothed moving averages of the “Volume Force” and includes a signal line.… more
