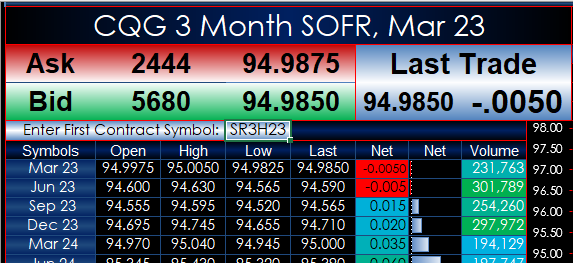
This Microsoft Excel® dashboard pulls in the 3-month SOFR market data traded on the CME Globex platform.
The Dashboard was updated to enable the user to enter in the symbol for the first contract. Use: SR3+Month+2 digit year, such as SR3H23.
More new features are detailed below.
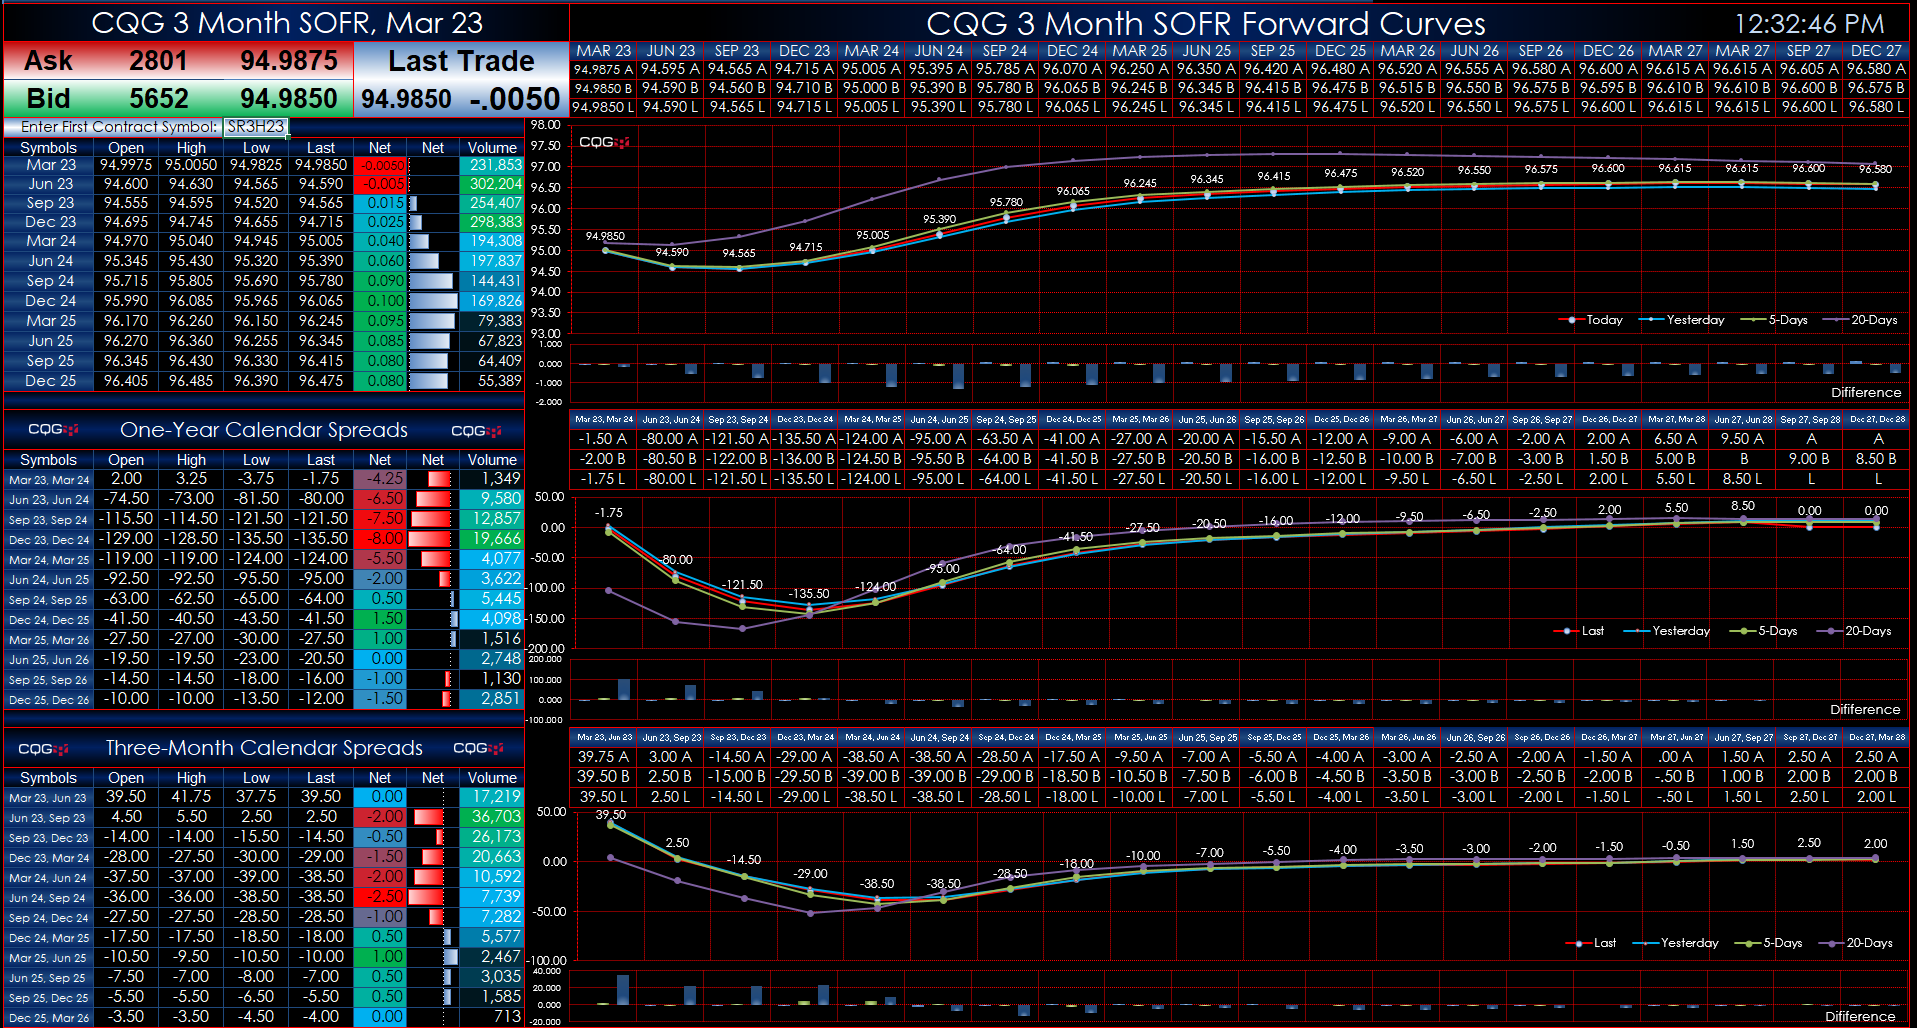
There are three forward curve charts. The first one displays the quarterly contracts forward curves, the second display is the one-year calendar spreads forward curves, and the third chart displays the three-month calendar spreads forward curves. Each chart displays today’s forward curve, yesterday’s forward curve, the forward curve 5-days ago, and the forward curve twenty days ago.
In addition, there is difference histogram chart showing each forward curves difference from today’s Forward Curve. There is the current best bid price, best ask price and last trade directly above the each forward curves data point.
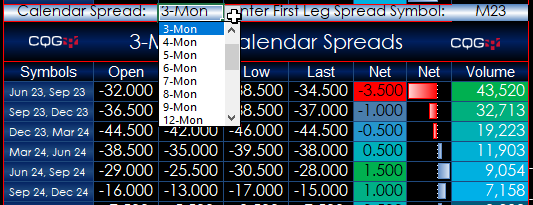
There are two dropdown menus (one each for the two forward curves). Select the calendar spread and then enter the first leg’s symbol.
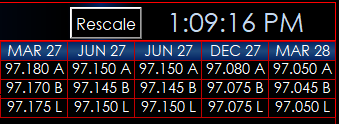
Also, if the prices are displayed outside the price axis then hit the “Rescale” button and the price axis will be corrected.
The left-hand side of the dashboard displays market data for the front contract and the next eleven contracts.