March is a critical month for the commodities that feed the world, as it marks the start of the planting season. As the snow melts, farmers warm up their equipment, prepare the soil, and plant the seeds that grow into grains, oilseeds, and other agricultural products.
The start of the crop year is a nervous time as the weather across the fertile Northern Hemisphere's plains is the primary factor determining if supplies meet the requirements. Each year, the weather is always the great unknown.
Meanwhile, in 2023, other factors are contributing to the concerns. The ongoing war in Europe's breadbasket and the bifurcation of the geopolitical landscape is interfering with trade and supplies. Inflation at the highest level in decades and rising interest rates have put upward pressure on production costs. Wheat, corn, and soybean prices are moving into the 2023 crop year at the highest pre-2021 level in years. Moreover, supply and demand balance sheets are tight, making the 2023 crop yields a significant factor for the path of least resistance of prices.
I reached out to Jake Hanley, the Managing Director and Sr. Portfolio Strategist at Teucrium, the company that founded the CORN, WEAT, and SOYB ETF products that reflect the price action in the CBOT futures arena for his take on the February World Agricultural Supply and Demand Estimates Report. Jake told me, "Nothing in today's reports change the fundamental fact that we in the U.S. are expected to use more corn, wheat, and soybeans than we produced in the '22-'23 crop year. With domestic balance sheets tightening we expect continued volatility over the next few months."
Elevated grain and oilseed prices going into the 2023 planting season
Nearby May corn prices were sitting above the $6.30 per bushel level on February 28.
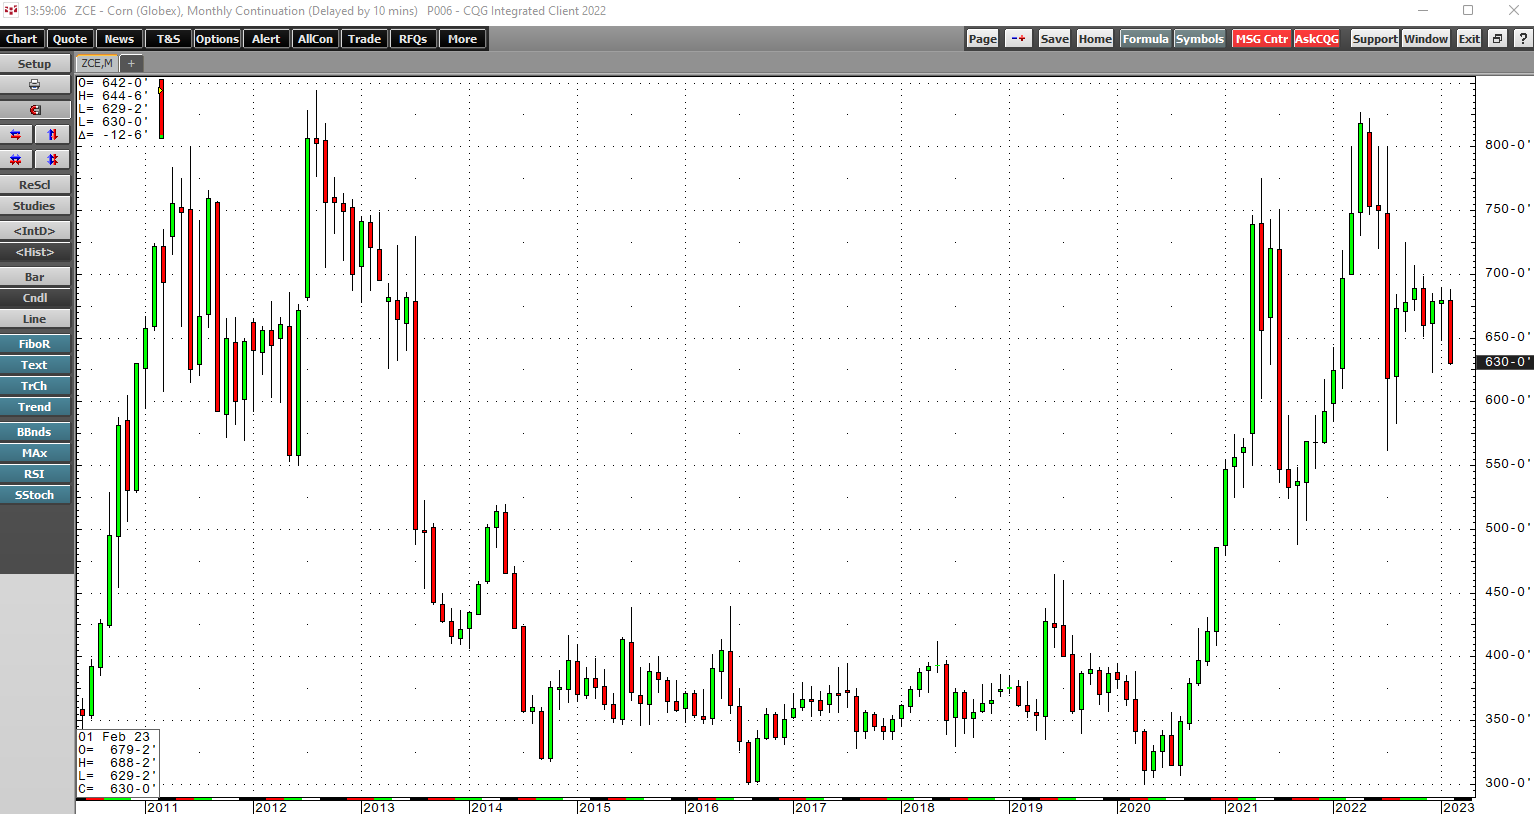
The monthly chart shows that while prices are lower than in February 2022, they remain at the highest pre-2022 February price since 2013.
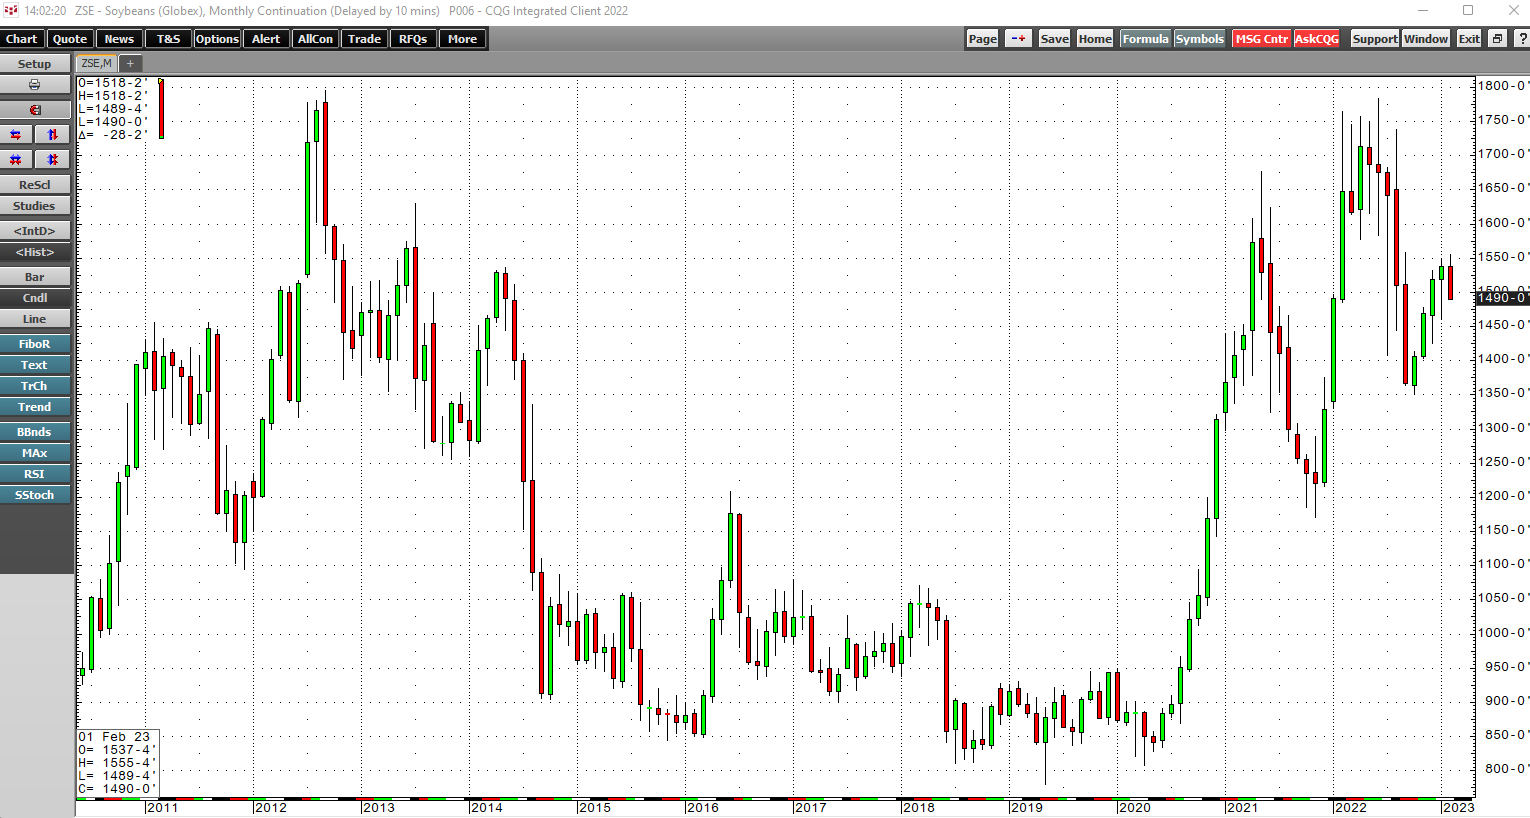
Nearby CBOT soybean futures prices near $14.80 per bushel were also lower than in February 2022 but at the highest February price since 2013.
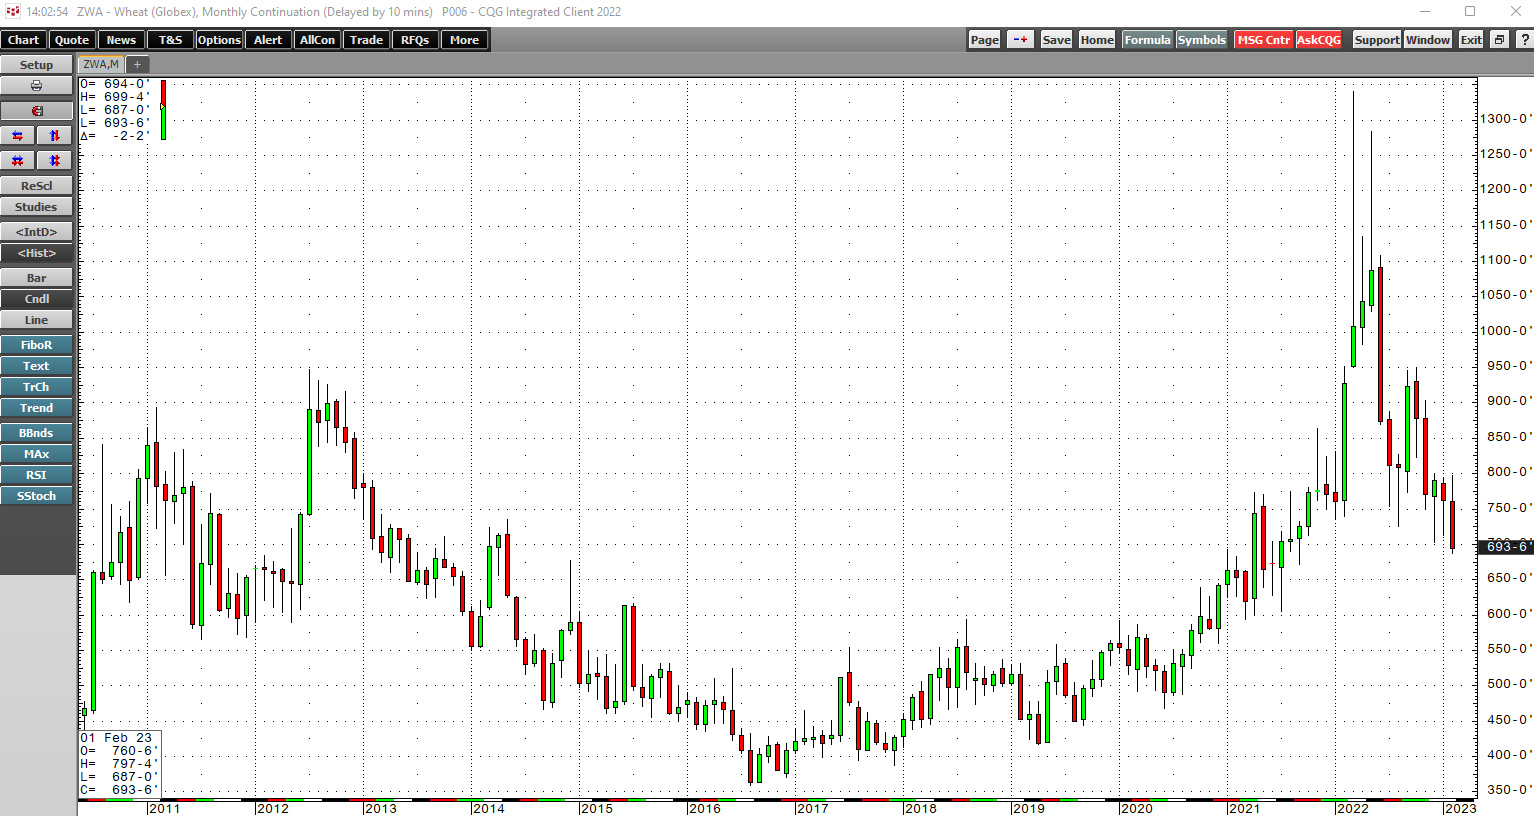
At above the $6.90 per bushel level at the end of February, nearby CBOT soft red winter wheat futures, the global benchmark for the primary ingredient in bread, was also at the highest price level since 2013.
Inflation has increased input costs
The latest January CPI, PEC, and PPI reports exceeded economists' expectations, as inflation remains at the highest level in decades. Inflation has increased energy, labor, financing, and all input costs for farmers, putting upward pressure on grain and oilseed prices.
While the U.S. central bank, and other worldwide monetary authorities, have tightened credit to battle inflation, one of the leading reasons for higher prices is beyond the central bank's reach. A hawkish monetary policy approach can address the economy's demand side, but supplies are another issue.
Geopolitics and the weather will determine the path of least resistance
The war in Ukraine and the bifurcation between the world's nuclear powers have caused food prices to rise. Ukraine and Russia are Europe's breadbasket. Ukraine has been the world's third leading exporter, with Russia tenth. Together they account for 12.8% of the world's corn exports. Russia is the world's top wheat exporting country, with Ukraine fifth, and the combined wheat exports are 21.6% of the world's annual shipments. Russia and Ukraine account for 1.73% of the world's soybean exports.
The fertile Ukrainian and Russian soil in Europe's breadbasket are battlefields, and the Black Sea Ports, the region's critical logistical export hub, is a war zone. Other countries must make up for losses from these critical producing countries as the war continues to rage and escalates.
The USDA's latest February World Agricultural Supply and Demand Estimates Report highlighted that grain and oilseed balance sheets remain tight. Global wheat inventories are at the lowest level since 2016/2017, and worldwide corn and soybean stockpiles have declined from January. As the markets head into the 2023 crop year in the Northern Hemisphere, other producers must make up for shortfalls, but the output demands on Mother Nature's weather. Any drought or flood conditions that further reduce global supplies could light an explosive fuse under the wheat, corn, and soybean futures markets over the coming months, with prices already sitting at a decade high before the first seeds go into the soil.
Expect a volatile 2023 crop year in the commodities that feed the world
In 2022, CBOT wheat prices rose to a record high, with corn and soybeans reaching the highest prices since the 2012 all-time peaks. While prices corrected, the factors that pushed prices higher last year remain intact and could deteriorate, causing explosive rallies in the commodities that feed, and increasingly power, the world. Corn is the primary ingredient in ethanol, the biofuel blended with U.S. gasoline, and soybean oil is the input in biodiesel. With Russia and OPEC keeping upward pressure on oil and oil product prices and the U.S. and Europe addressing climate change with alternative and renewable fuels, the demand for agricultural products will likely rise, fueling even more volatility in the grain and oilseed arenas.
New CQG products can enhance your trading activities
Trading the agricultural markets requires the best tools that enhance analysis and put you one step ahead of other market participants. The highest volatility in years makes these tools imperative.
CQG continues to expand its suite of algorithmic products, including Arrive Price, VAP, TWAP, Iceberg, PayUp, and more. More information about these products is available via this link.
New features in CQG IC 2023 include Aggregation Trader, which is is CQG's newest trading application for traders that simultaneously work orders on two or more exchanges.
When comparing a portfolio of symbols' net price change or net percentage change, the new Net Change Curve Chart is a handy tool that increases speed and efficiency.
The CME and other exchanges provide data on who the aggressor (buyer or seller) is when a trade executes. The Aggressor product pulls liquidity out of the order book by triggering a match event removing resting quantity, and potentially impacting the price level from the order book. CQG customers can add the Aggressor Flag to volume and volume profile studies, TFlow charts, Time & Sales, QSS, and QSS2.0. More information is available via this link.
As the 2023 crop year begins, we need all the help we can get to make the best decisions, limiting risk and maximizing profits. CQG is a unique tool for those market participants taking full advantage of its many features.