In his TraderPlanet article, Build Smart Performance Tables in Excel® Using RTD, CQG Director of Product Training Thom Hartle shows how to build a custom dashboard showing market performance over… more
CQG AutoTrader provides automated execution of trading systems developed in CQG Integrated Client. Trade strategy development and backtesting are our core functionalities. With CQG AutoTrader, we… more
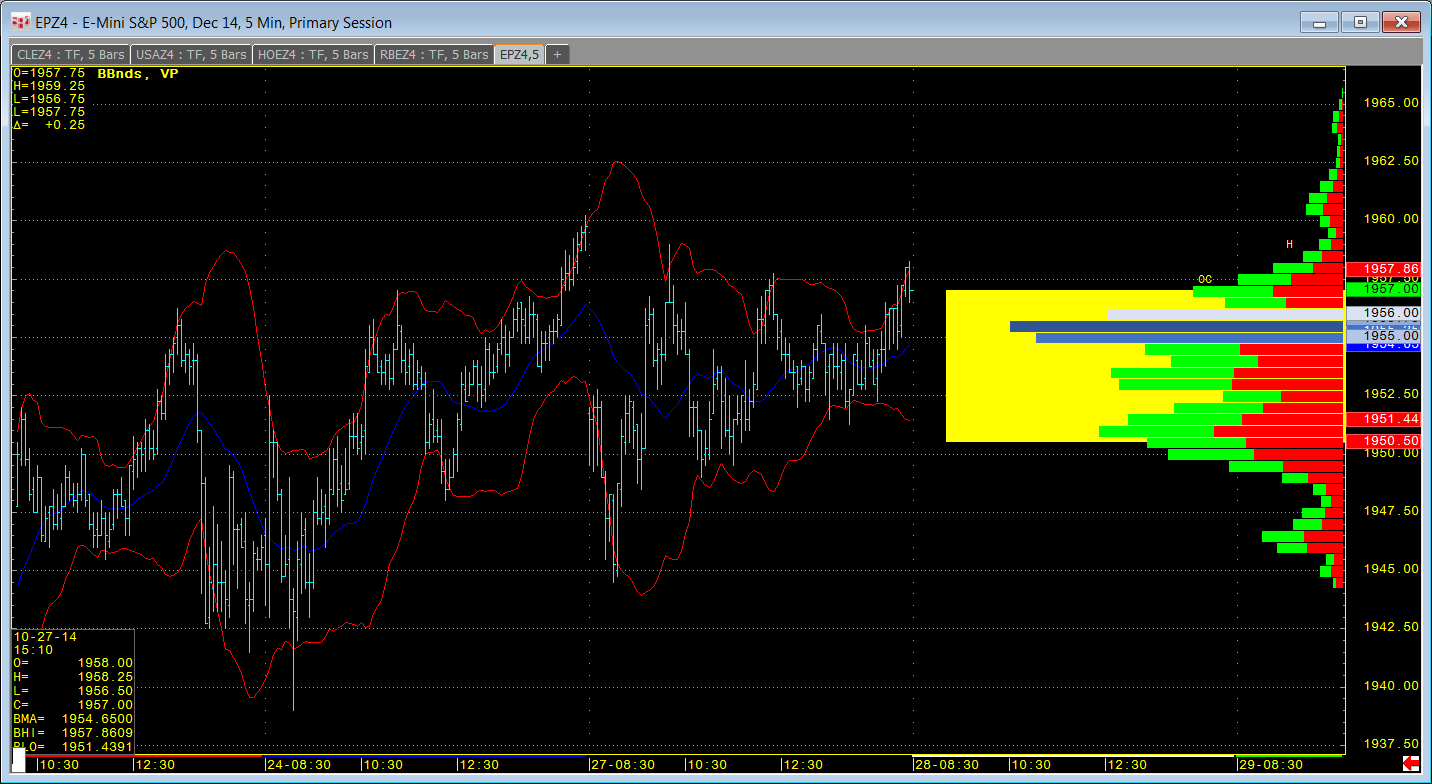
The Volume Profile study includes new features to give you better insight into what market participants are doing. With the addition of analytics data, you now have the ability to analyze volume… more
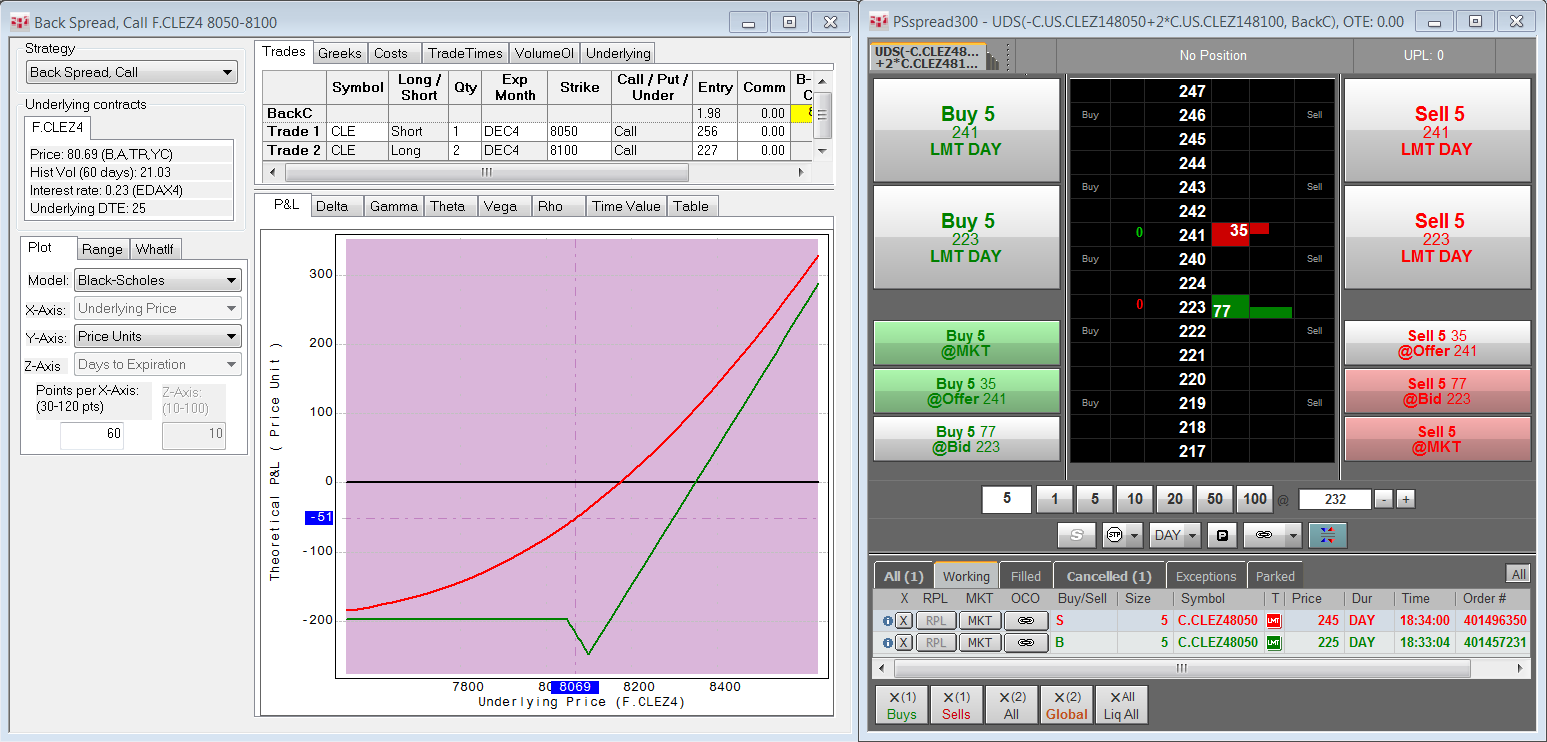
We now support trading User-Defined Strategies (UDS), which are tradable synthetic options spread strategies. This makes trading options spreads a more seamless task.
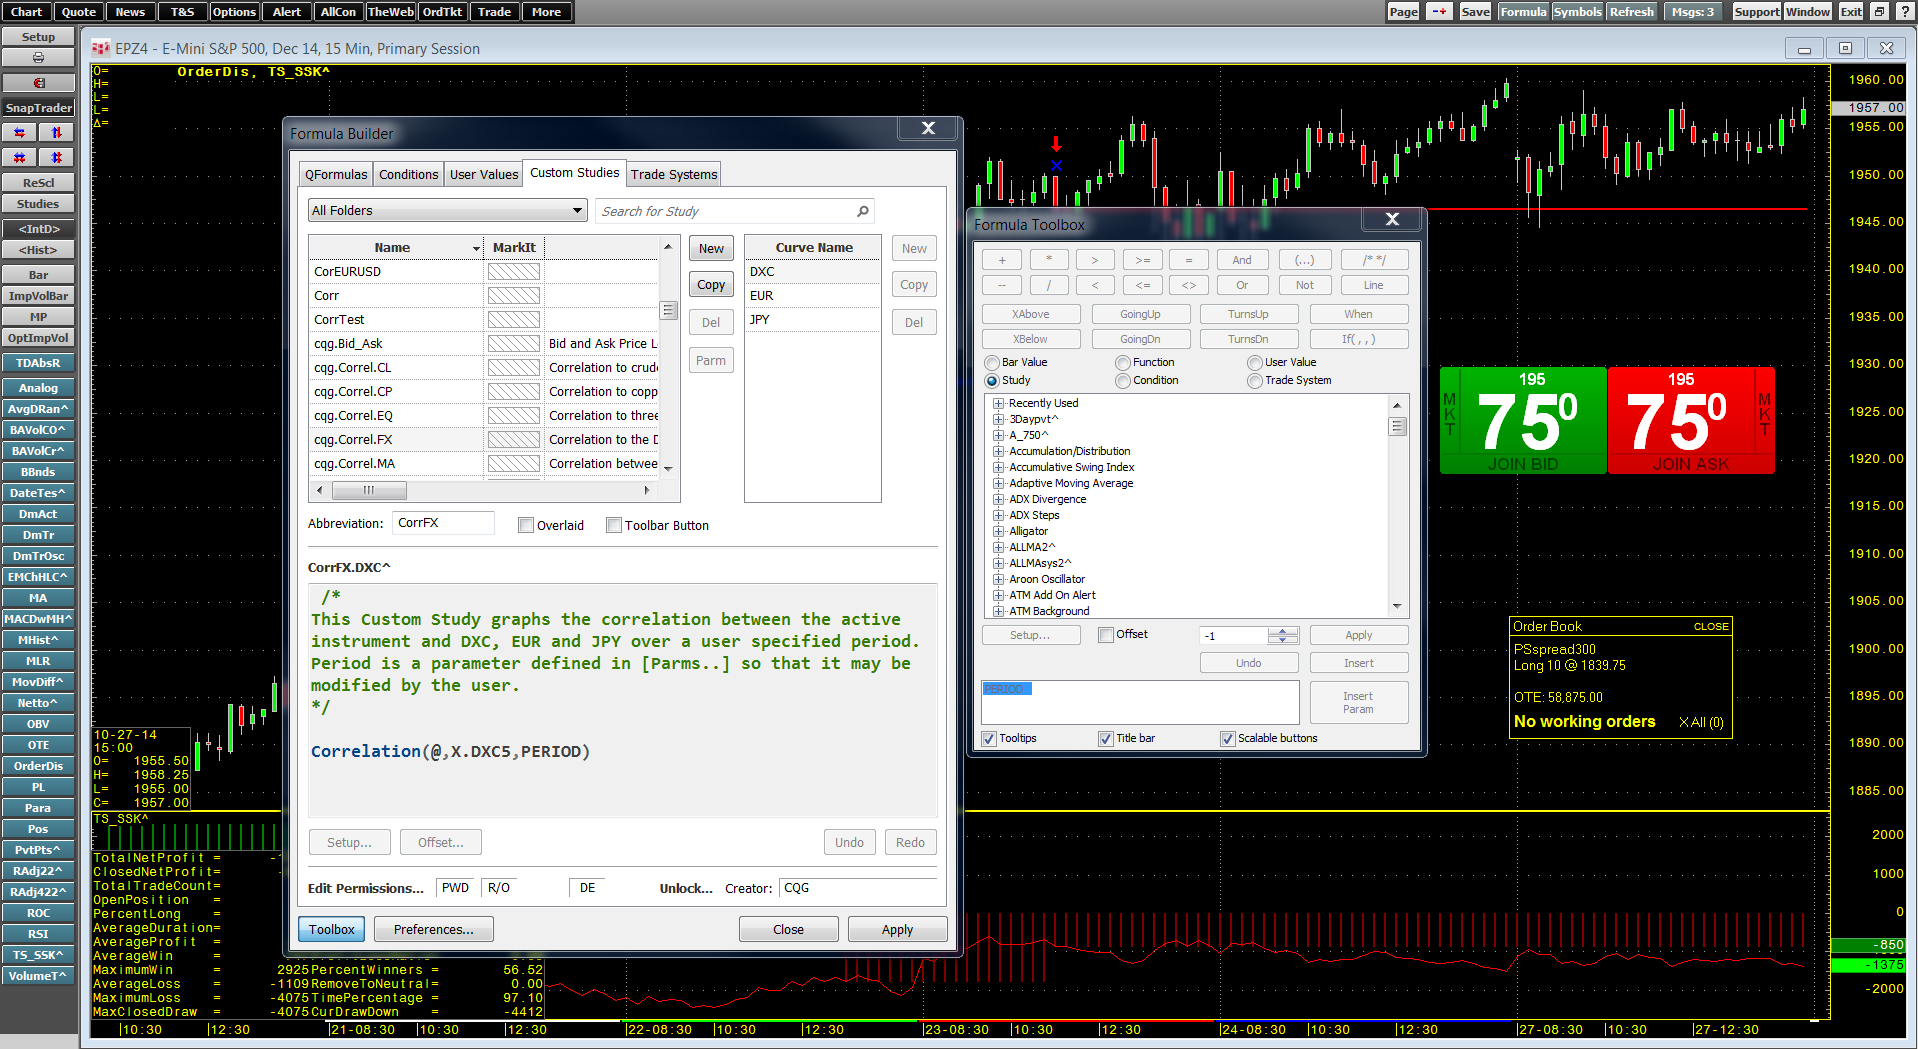
Formula Builder has been redesigned to better match a trader's workflow with a more modern look. Some functionality has been relocated in the main display and a new preferences feature has been… more
Learn how to automatically execute systems in a fast and systematic way.
Watch Jim Stavros and Doug Janson demonstrate CQG AutoTrader in CQG Integrated Client and API.
The webinar:… more
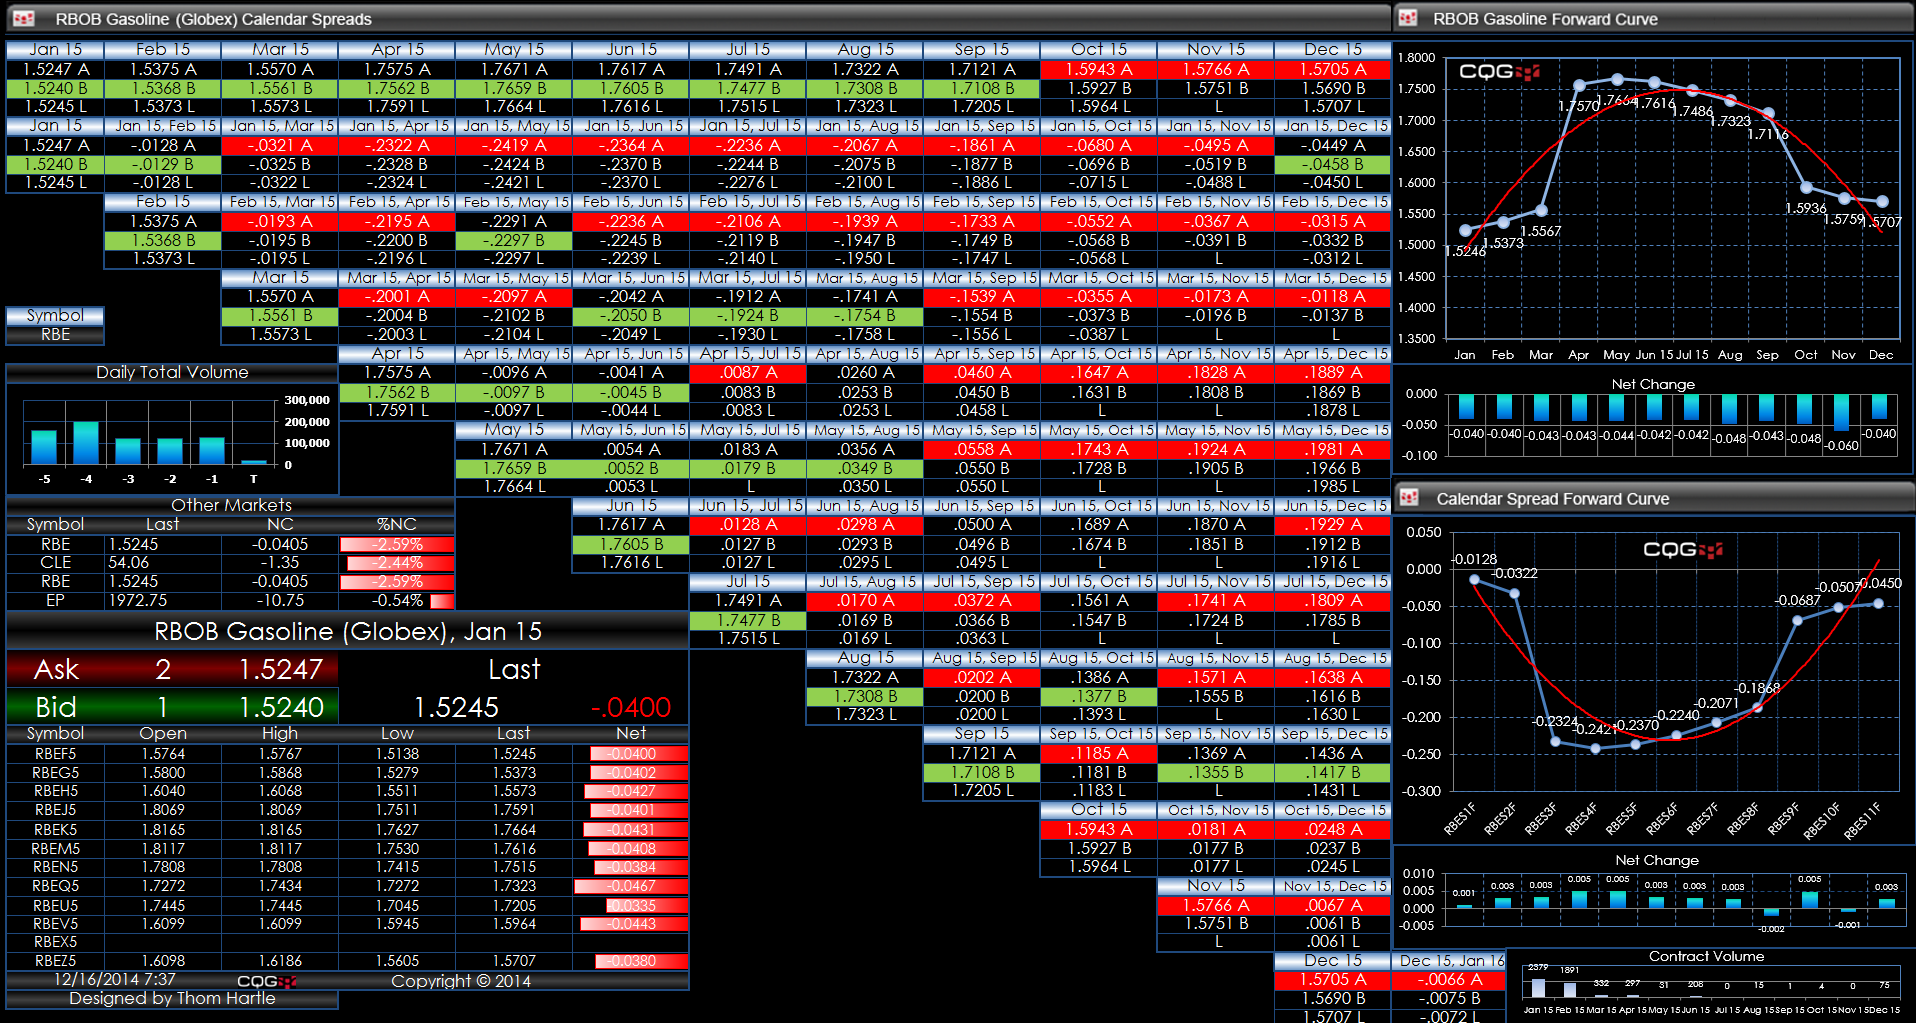
This Microsoft Excel® spreadsheet uses a matrix format to show the RBOB gasoline market traded on the CME Globex electronic trading platform.
This dashboard screen capture shows the inside… more
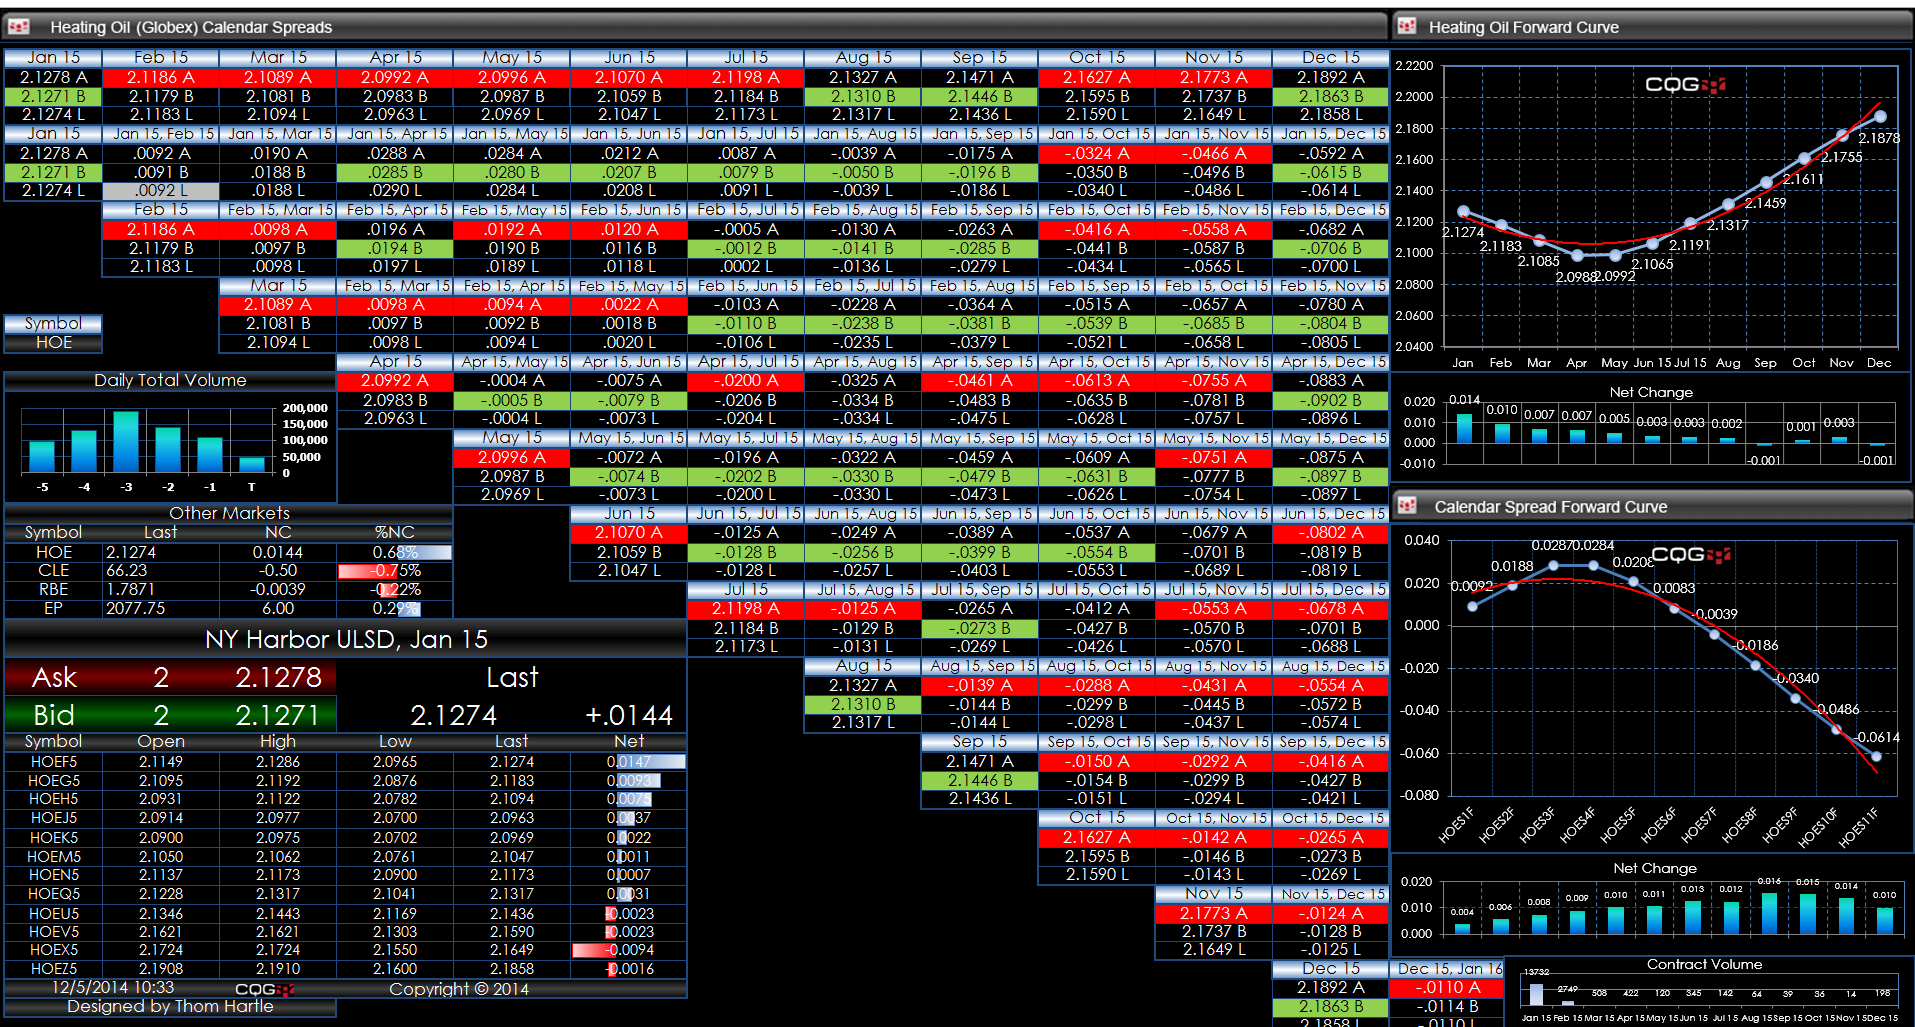
This Microsoft Excel® spreadsheet uses a matrix format to show the heating oil market traded on the CME Globex electronic trading platform.
This dashboard screen capture shows the inside… more
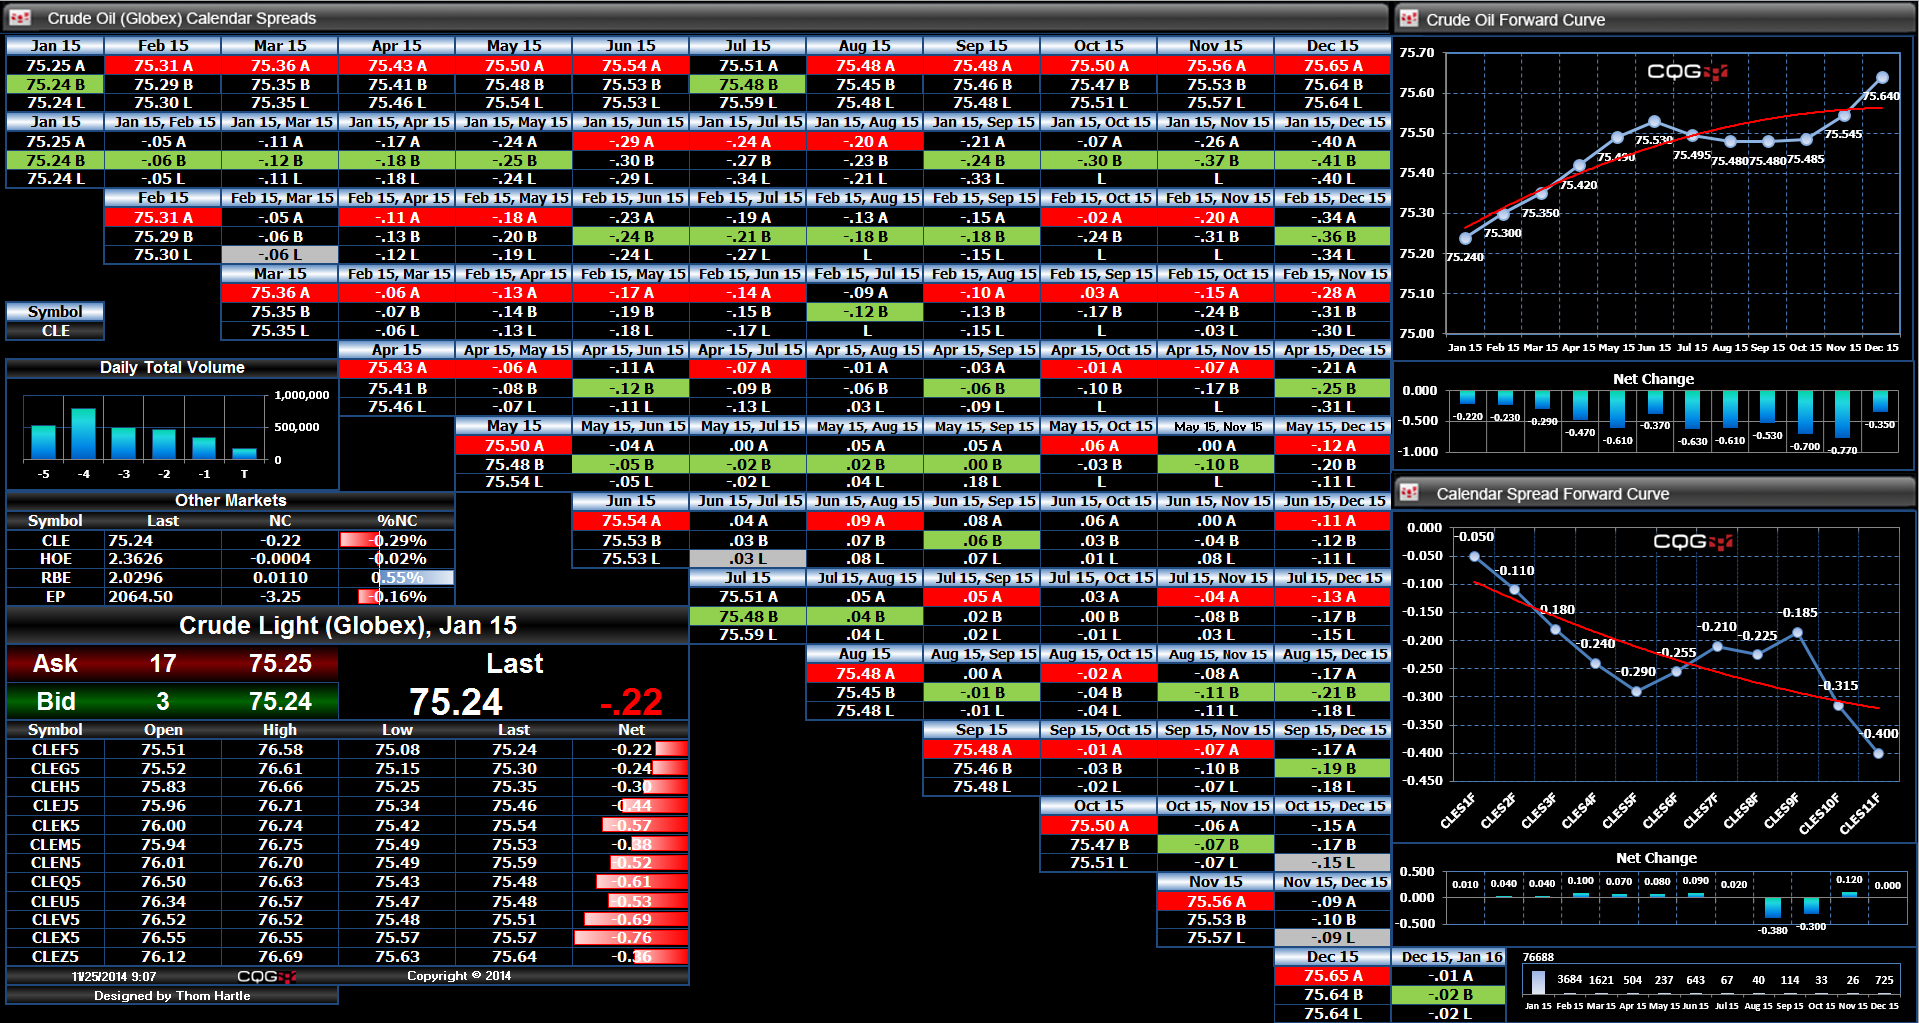
This Microsoft Excel® spreadsheet uses a matrix format to show the crude oil market traded on the CME Globex electronic trading platform.
This dashboard screen capture shows the inside… more
In order to smoothly transition from DDE to RTD, CQG provides a tool that converts all DDE-coded spreadsheets into RTD format. This zip file contains the converter for updating DDE coding in Excel… more
