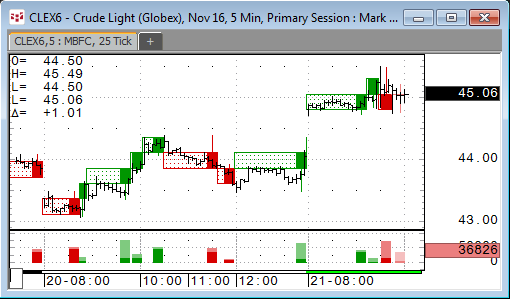
Mark B. Fisher Chart on CQG
In this live webinar, Mark B. Fisher discusses how he uses his new Fisher Bar Indicator within the context of his ACD trading methodology. ACD is a trading methodology developed by Mark Fisher and detailed in his book, The Logical Trader. Mr. Fisher also shows:
- Concepts behind the MBF Chart
- How he uses the indicator to interpret the day's price action
- How he combines the indicator with the ACD system and pivot ranges to obtain an overall picture of the day's trading
- How to determine price levels where trades can be placed
Learn more about the Mark Fisher Indicator
Presenter: Mark B. Fisher, an independent trader, is the founder of MBF Clearing Corp. Fisher has taught his trading methodology, which he calls the ACD system, to more than 5,000 people, including many traders at leading hedge funds such as Tudor Investments. Fisher has been trading since he was twenty-one, when he became the youngest trader ever in the silver futures pit. A 1982 summa cum laude graduate from the Wharton School of Business, Fisher also received his master's degree in finance and accounting from Wharton.
Promotion Disclaimer: Existing CQG Integrated Client customers have free access to the MBF Chart on October 3, 2016 – January 3, 2017. Prospective customers are eligible for a two-week free trial of CQG Integrated Client, including the MBF Chart during this period. CQG version 2016 is required.