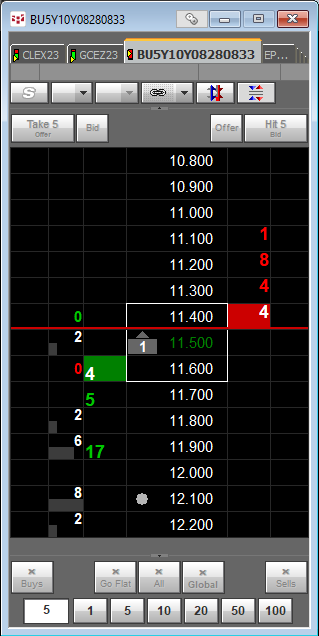
Customers of BrokerTec can now trade the Relative Value (RV) Treasury Spreads. BrokerTec is the price discovery leader for benchmark cash U.S. Treasuries.
RV Curve offers 21 spreads. This provides a full view of the relative value relationships between 2-year, 3-year, 5-year, 7-year, and 10-year Treasury notes and 20-year and 30-year Treasury bonds.
| Symbol | Last | NC | Vol Bid | Bid | Ask | Vol Ask | Description |
|---|---|---|---|---|---|---|---|
| T.US.BU2Y3Y | 0 | 0 | 2yr-3yr Btec RV Curve | ||||
| T.US.BU2Y5Y | 53.4 | 0.8 | 2 | 53.6 | 53.4 | 4 | 2yr-5yr Btec RV Curve |
| T.US.BU2Y7Y | 57 | 1 | 4 | 57 | 56.8 | 4 | 2yr-7yr Btec RV Curve |
| T.US.BU2Y10Y | 65.4 | -0.6 | 4 | 65.4 | 65.2 | 4 | 2yr-10yr Btec RV Curve |
| T.US.BU2Y20Y | 37 | 2 | 37.7 | 37 | 3 | 2yr-20yr Btec RV Curve | |
| T.US.BU2Y30Y | 56.6 | -3.4 | 1 | 56.6 | 56.1 | 2 | 2yr-30yr Btec RV Curve |
| T.US.BU3Y5Y | 0 | 0 | 3yr-5yr Btec RV Curve | ||||
| T.US.BU3Y7Y | 0 | 0 | 3yr-7yr Btec RV Curve | ||||
| T.US.BU3Y10Y | 0 | 0 | 3yr-10yr Btec RV Curve | ||||
| T.US.BU3Y20Y | 0 | 0 | 3yr-20yr Btec RV Curve | ||||
| T.US.BU3Y30Y | 0 | 0 | 3yr-30yr Btec RV Curve | ||||
| T.US.BU5Y7Y | 3.3 | -0.4 | 5 | 3.5 | 3.3 | 5 | 5yr-7yr Btec RV Curve |
| T.US.BU5Y10Y | 11.7 | -0.9 | 4 | 11.9 | 11.7 | 4 | 5yr-10yr Btec RV Curve |
| T.US.BU5Y30Y | 2.8 | -1.7 | 2 | 2.9 | 2.8 | 2 | 5yr-30yr Btec RV Curve |
| T.US.BU5Y20Y | -16.5 | -1.5 | 2 | -16.1 | -16.5 | 3 | 5yr-20yr Btec RV Curve |
| T.US.BU7Y10Y | 8.3 | -0.8 | 5 | 8.5 | 8.3 | 5 | 7yr-10yr Btec RV Curve |
| T.US.BU7Y30Y | -0.9 | 3 | -0.3 | -0.9 | 2 | 7yr-30yr Btec RV Curve | |
| T.US.BU7Y20Y | -19.3 | 4 | -19.3 | -20 | 6 | 7yr-20yr Btec RV Curve | |
| T.US.BU10Y20Y | -27.8 | -0.6 | 7 | -27.8 | -28.2 | 3 | 10yr-20yr Btec RV Curve |
| T.US.BU10Y30Y | -8.8 | -0.9 | 5 | -8.8 | -9 | 5 | 10yr-30yr Btec RV Curve |
| T.US.BU20Y30Y | 18.9 | -0.4 | 3 | 19.3 | 18.9 | 6 | 20yr-30yr Btec RV Curve |
Trades can be executed in a single order. This feature offers the opportunity to trade the yield curve more efficiently and without legging risk.
The spread is traded at a +/- yield differential with inverted prices. The bid is higher than the offer. The outright legs will trade in prices requiring price-to-yield and yield-to-price conversions.
More details are available from the CME Globex web site.
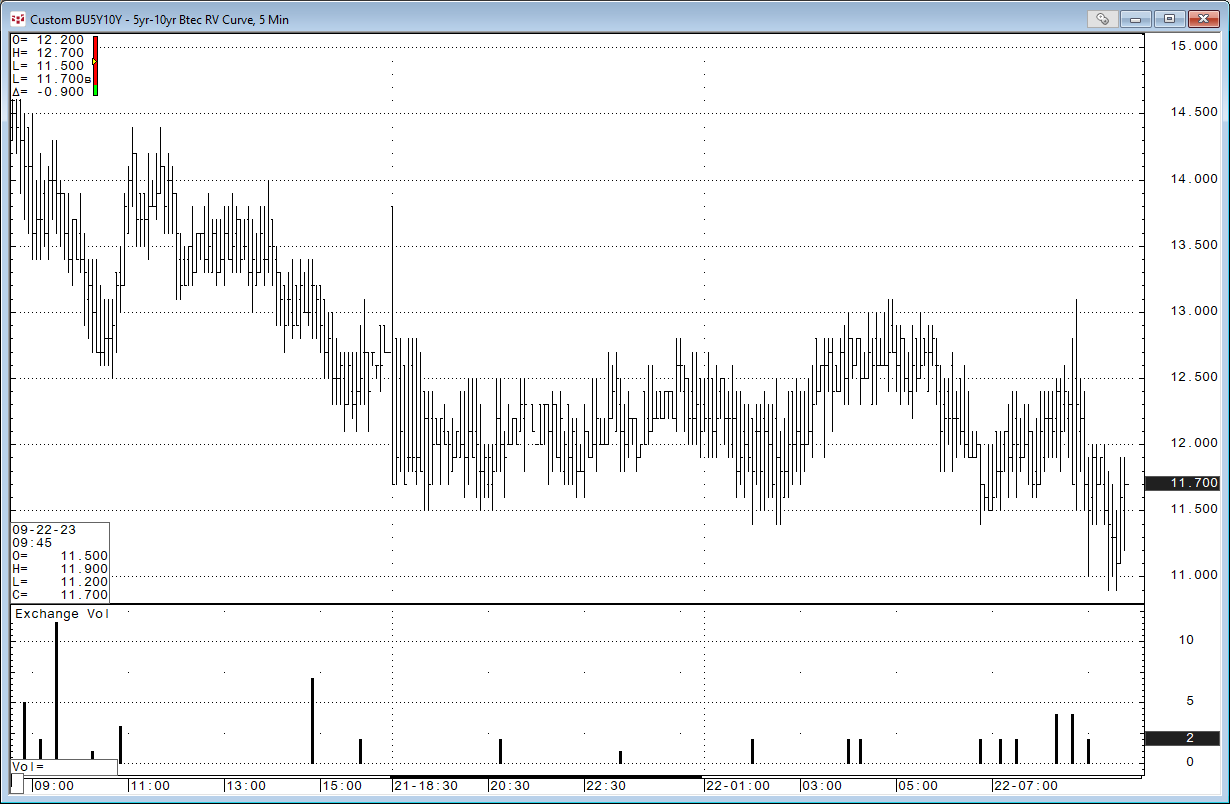
CQG charts enable you to display the bids and asks, as well as the trades and settlement.
The volume study in the chart below indicates bars with actual trades.
Leveraging the power of CME Globex, the RV Curve merges liquidity from the central limit order book with a single-threaded matching engine:
- Eliminating legging risk
- Providing inside liquidity
- Increasing matching opportunities when trading benchmark spreads

