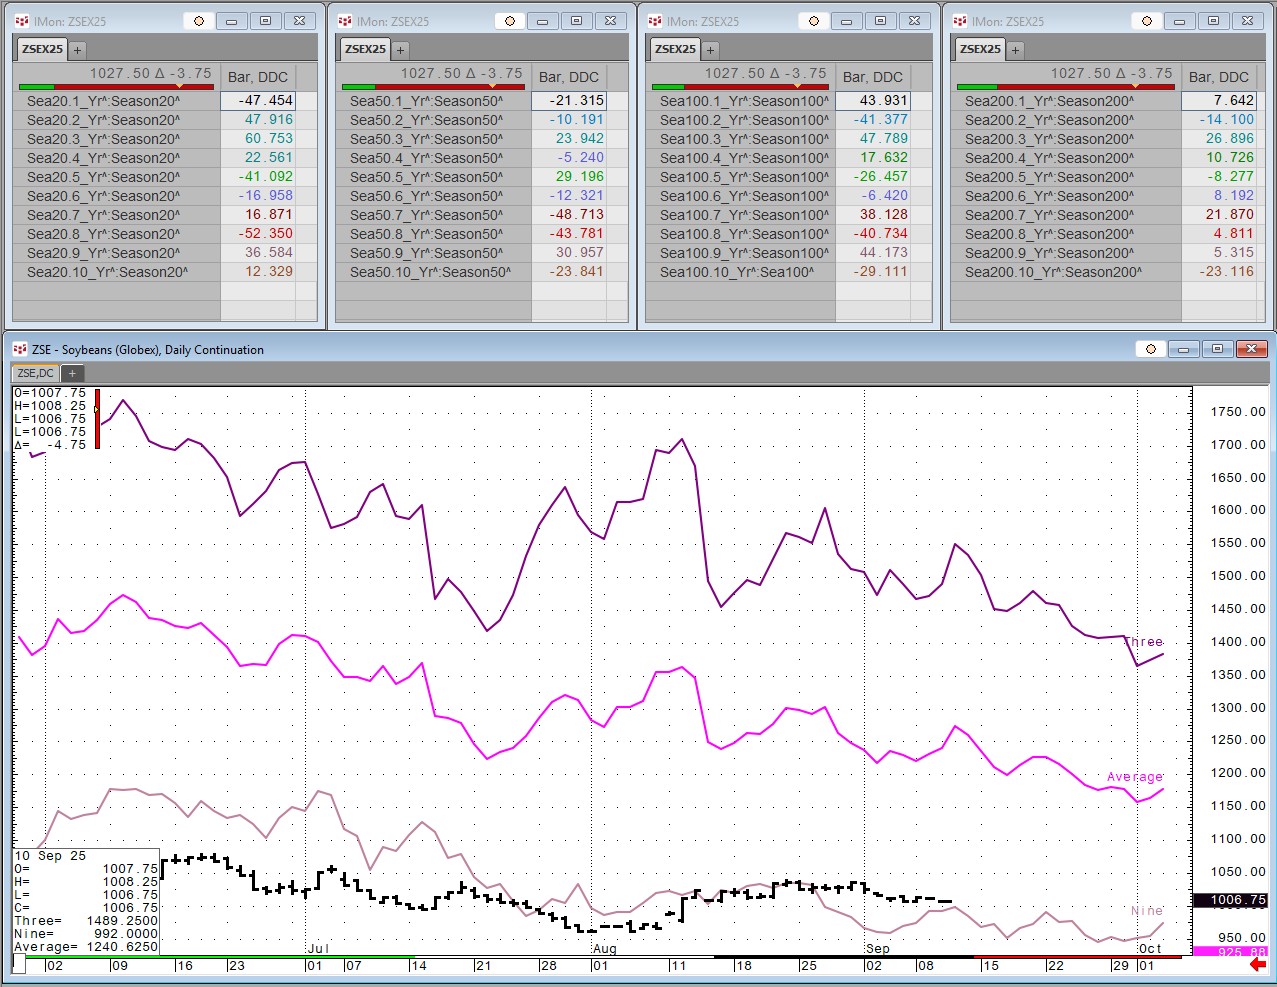
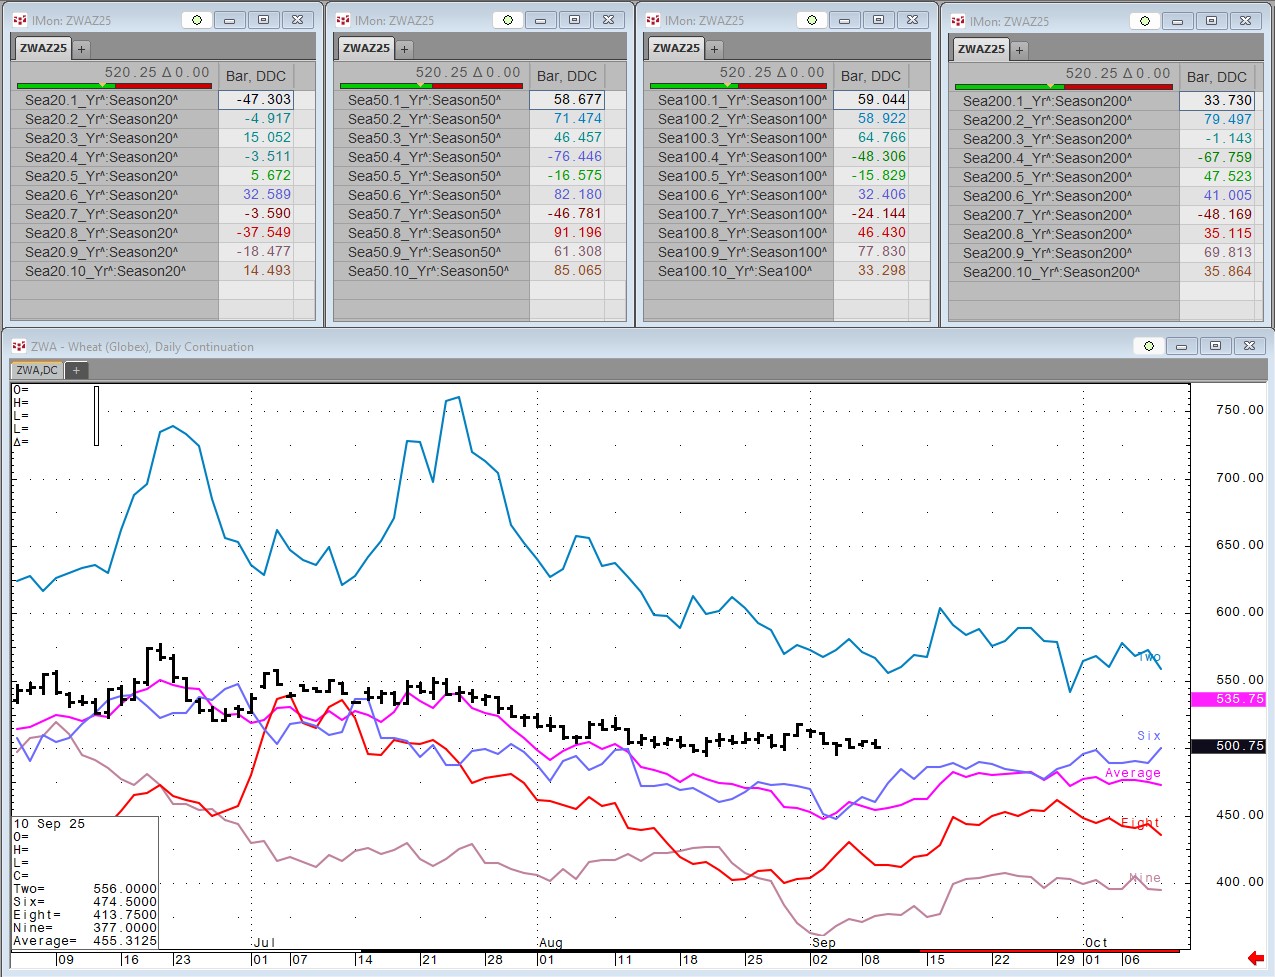
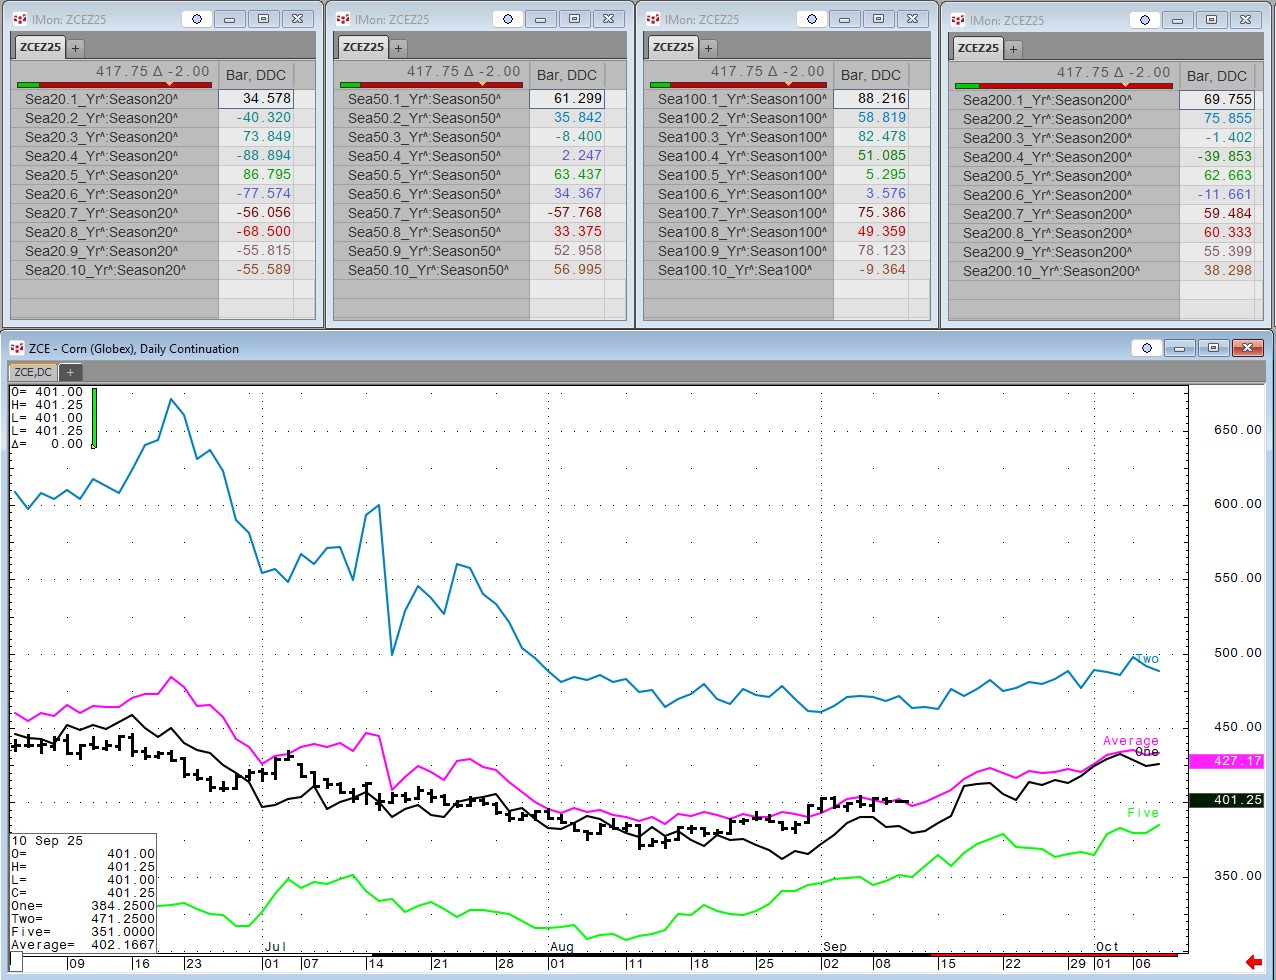
Each Wednesday this article will be updated with the current seasonal study using CQG's Seasonal analysis applied to the Soybean, Wheat and Corn markets. You can download the CQG pac providing the studies and charts here. In addition, the seasonal data lines can be pulled into Excel using RTD formulas.
Below each chart are two tables. The first table is the highest correlation of the current market data to the seasonal year using a 20-day, 50-day, 100-day and the 200-day lookback periods. The second table is the previous week's data. Seasonal analysis is about price direction or the trend.
Soybeans
| This Week's Data | ||||
| Correlation Lookback (Days) | 20 | 50 | 100 | 200 |
| Seasonal Year Back with the Highest Correlation | 3_Yr 60.75 | 9_Yr 30.96 | 3_Yr 47.79 | 3_Yr 26.90 |
| Last Week's Data | ||||
| Correlation Lookback (Days) | 20 | 50 | 100 | 200 |
| Seasonal Year Back with the Highest Correlation | 5_Yr 60.30 | 9_Yr 36.60 | 3_Yr 47.74 | 3_Yr 26.45 |
Wheat
| This Week's Data | ||||
| Correlation Lookback (Days) | 20 | 50 | 100 | 200 |
| Seasonal Year Back with the Highest Correlation | 6_Yr 32.59 | 8_Yr 91.20 | 9_Yr 77.83 | 2_Yr 79.50 |
| Last Week's Data | ||||
| Correlation Lookback (Days) | 20 | 50 | 100 | 200 |
| Seasonal Year Back with the Highest Correlation | 3_Yr 38.14 | 8_Yr 86.51 | 9_Yr 72.42 | 2_Yr 76.78 |
Corn
| This Week's Data | ||||
| Correlation Lookback (Days) | 20 | 50 | 100 | 200 |
| Seasonal Year Back with the Highest Correlation | 5_Yr 86.80 | 5_Yr 63.44 | 1_Yr 88.22 | 2_Yr 75.86 |
| Last Week's Data | ||||
| Correlation Lookback (Days) | 20 | 50 | 100 | 200 |
| Seasonal Year Back with the Highest Correlation | 5_Yr 73.07 | 9_Yr 68.03 | 1_Yr 86.25 | 2_Yr 73.84 |


