Markets tend to trend up, down, and sideways. Another name for trending sideways is congestion. A period of congestion is when the Open, High, Low, and Close price bars are overlapping. CQG IC and QTrader offer a study to identify periods when a market is in a congestion phase. Here is a link to the Help File.
Two methods are used to identify areas of congestion: Last or Group. Last refers to the last bar sharing price range values with previous bars and group refers to every bar in the group sharing price range values. When the price range values are no longer shared with previous bars or grouped bars the counter is reset to one.
The counter will reset itself to one when price values are no longer shared with previous bars or grouped bars. It will then increase when sharing takes place.

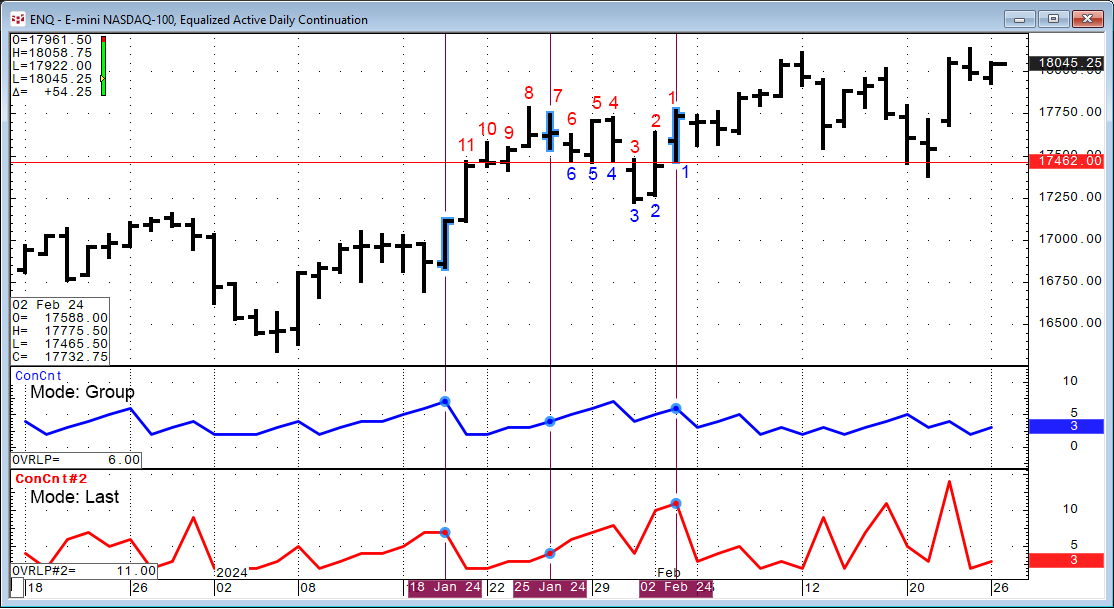
In the chart shown above, the Congestion study red line counts all the bars that are included in the overlap count for Last mode. The 11 bars to the left of the February 02 bar overlap it. The selected bar is included in the count. The next bar to the left does not overlap with the selected bar, so it is not counted. The Congestion study blue line is using the Group mode. Group mode requires each bar in a group to overlap all other bars in the group. The count numbers on the chart are edited in and do not appear as part of the study.
The study has a lookback parameter. The default lookback is 100 bars.
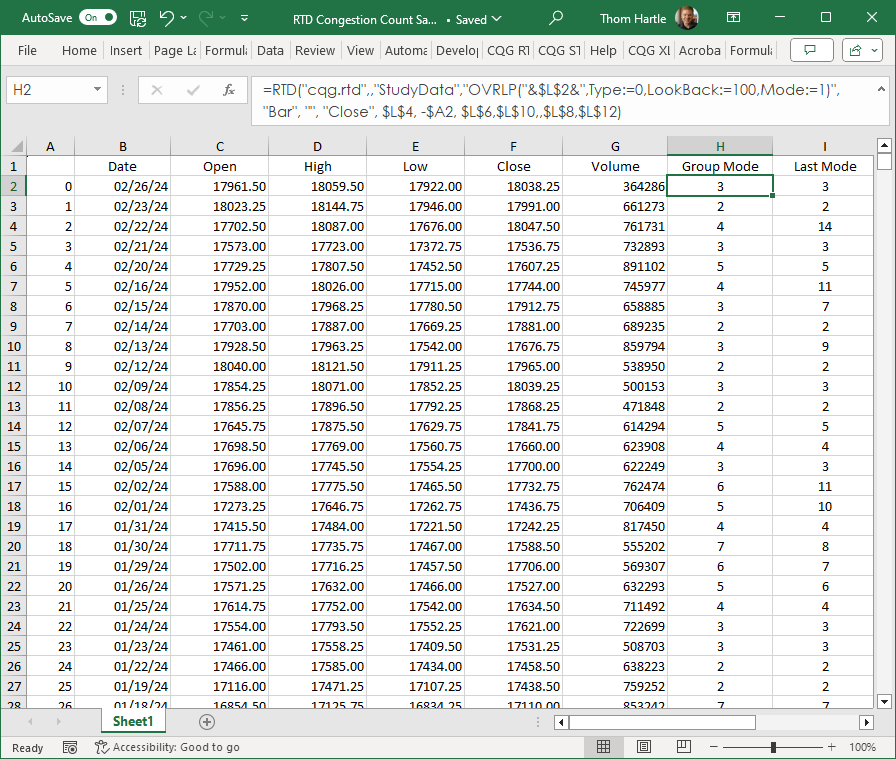
Excel RTD users can use these RTD calls.
Last Mode:
=RTD("cqg.rtd",,"StudyData","OVRLP(ENQ,Type:=0,LookBack:=100,Mode:=0)", "Bar", "", "Close","D","0",,,,,"T")Group Mode:
=RTD("cqg.rtd",,"StudyData","OVRLP(ENQ,Type:=0,LookBack:=100,Mode:=1)", "Bar", "", "Close","D","0",,,,,"T")The downloadable sample can pull historical values.
The study can be useful for identifying periods of market congestion which can be a prelude to an emerging upward or downward market trend.
Requires CQG Integrated Client or CQG QTrader, and Excel 2016 or more recent.
