This post detailed the Double Exponential Moving Average Study or DEMA. DEMA is helpful for technical analysis because it reduces the lag of traditional moving averages, such as the simple moving average and the exponential moving average. The image below from the post shows the differences.
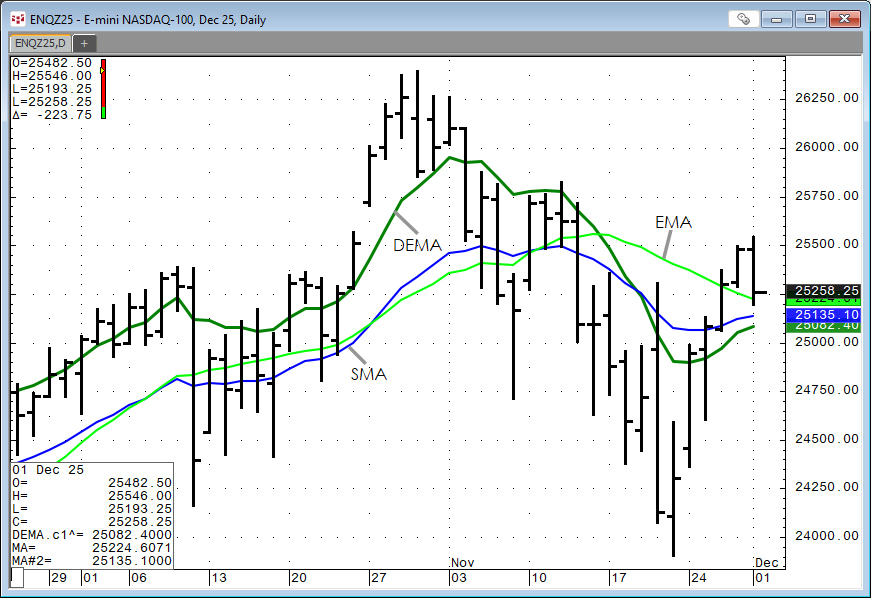
The chart above displays the DEMA (green line), Simple Moving Average (blue line), and an Exponential Moving Average (light green line), all using a lookback period of 21. The 21-period DEMA does appear to track the market movement closer than the other two averages. In other words, less lag.
CQG Product Specialist Jim Stavros built a DEMA based Moving Average Convergence/Divergence study, which is the main topic of this post.
First, a short overview of the traditional MACD study.
The MACD (Moving Average Convergence/Divergence) oscillator was invented by Gerald Appel in the late 1970s.
The MACD is an oscillator study. It measures the difference between two exponential moving averages of different lengths, in addition, a trailing moving average of the MACD is plotted (MACDA), this is commonly referred to as the "Signal" line. The two moving averages have different sensitivities to market action, thereby providing an indication of a change in the market direction, such as the emergence of a new trend or a trend reversal. Gerald Appel defined the MACD with its default parameter values using closing prices:
MACD = Exponential MA1 - Exponential MA2
MACDA = Exponential MA of MACD
Where:
MACD = 12-period EMA - 26-period EMA
MACDA = 9-period EMA (MACD)
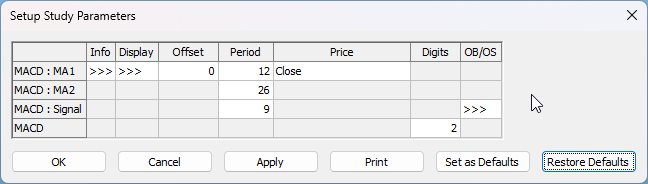
In the image above of the MACD preferences the "MACD: Signal" is the MACDA.
The basic signals are:
Buy: The MACD crosses above the MACDA.
Sell: The MACD crosses below the MACDA.
A Sell signal and a Buy signal are displayed in the next image.

The light green line on the bar chart is the 12-period EMA. The red line is the 26-period EMA.
This cherry-picked example does indicate that the use of the EMAs suggests a great deal of lag between the markets price action and the signals.
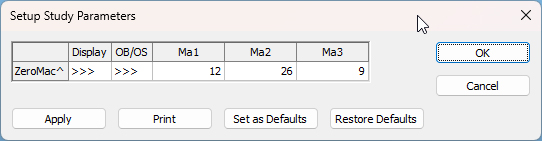
This next chart includes Mr. Stavros' version of the MACD, which uses DEMAs instead of EMAs. The study is named ZeroMac and uses the same lookback periods as the standard MACD study.
The image below includes the 12-period DEMA (the light green line) and the 26-period EMA (the red line) plotted on the chart.

In this cherry-picked example the DEMA based MACD is more sensitive to the price action compared to the standard MACD. Both the Sell and the Buy signals are earlier compared to the standard MACD in the previous image. However, this increased sensitivity will mean more signals.
The CQG PAC available at the bottom of the post installs a page in IC or QTrader with four charts that include the DEMA study and the ZeroMac study.
Requires CQG Integrated Client or CQG QTrader.