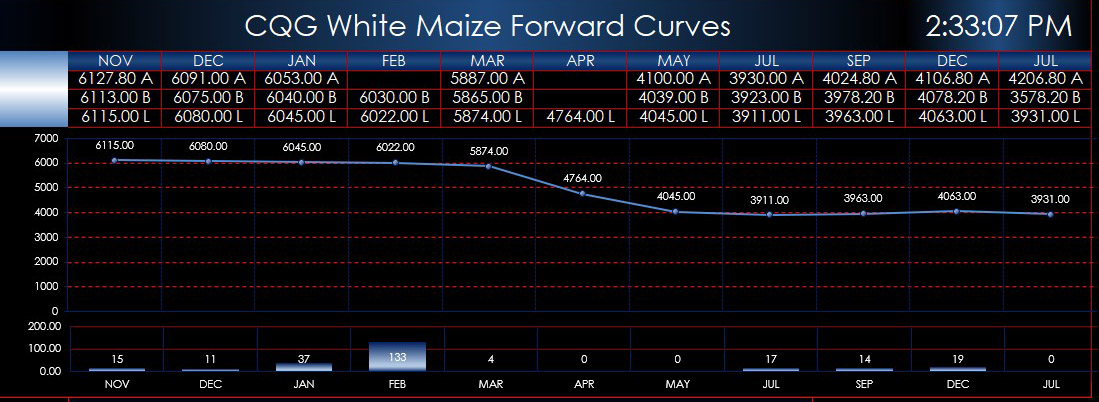
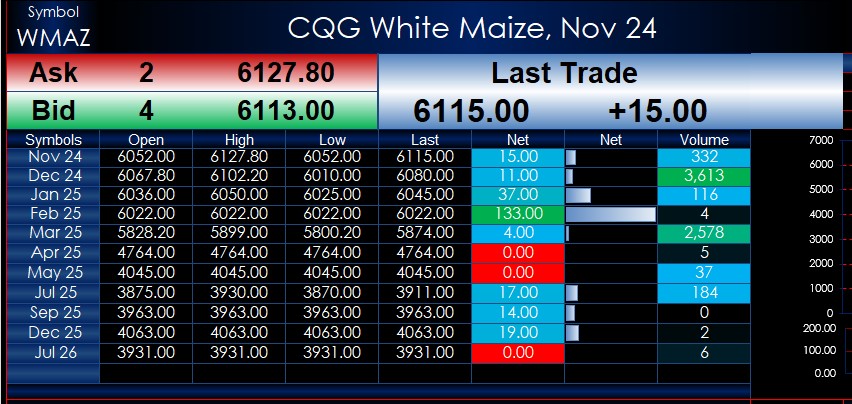
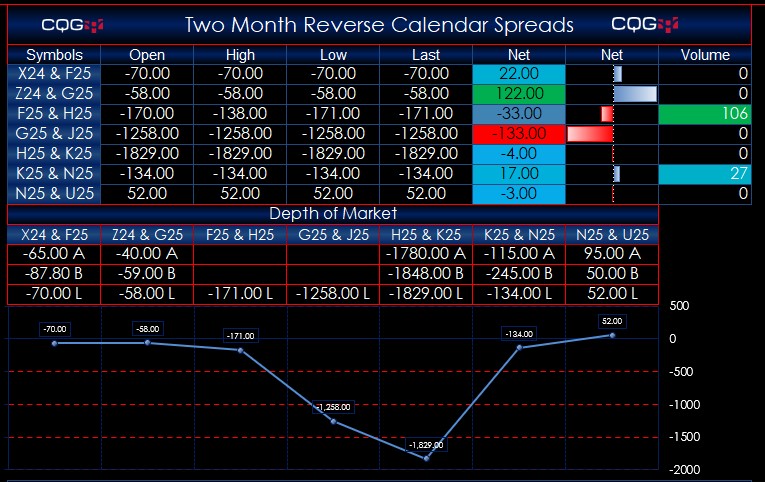
The forward curves dashboard displays futures contracts White Maize (symbol: WMAZ), Yellow Maize (symbol: YMAZ), Wheat (symbol: WEAT), Soybeans (symbol: SOYA), and Sunflower Seeds (symbol: SUNS), traded on the Johannesburg Stock Exchange. The dashboard displays market data and forward curves for the outright contracts and one through six month reverse calendars spreads.
Above each data point on the forward curve is the current best bid, best ask, and last trade or today’s settlement.
The last trade is plotted on the forward curve unless if the last trade is outside of the best bid and best ask then the mean between the best bid and best ask is plotted. If either the best bid or best ask are not available or no last trade then the data point is skipped on the forward curve. When the settlements come through then the settlement is used for the forward curve.
There is a table with the following columns: Symbols, Open, High, Low, Last, Net change, and Volume. The Net Change and Volume columns are heat mapped.
For each of One to Six month Reverse Calendar spreads the table displays the following columns: Symbols, Open, High, Low, Last, Net change, and Volume. The Net Change and Volume columns are heat mapped.
Above each data point on the forward curve is the current best bid, best ask, and last trade or today’s settlement.
The last trade is plotted on the forward curve unless if the last trade is outside of the best bid and best ask then the mean between the best bid and best ask is plotted. If either the best bid or best ask are not available or no last trade then the data point is skipped on the forward curve. When the settlements come through then the settlement is used for the forward curve.
Requirements: CQG Integrated Client or QTrader, enablement for the JSE Derivatives Exchange and Excel 2016 (locally installed, not in the Cloud) or more recent.


