A recent post "CQG Primer: Candlesticks Formations Study" introduced this study available in CQG IC and QTrader. The study is a collection of fifteen conditions. The Candlestick formations appear as overlays on the chart in the colors selected in parameters. The abbreviations of the particular condition appears below the formation for bullish formations and above for bearish formations.
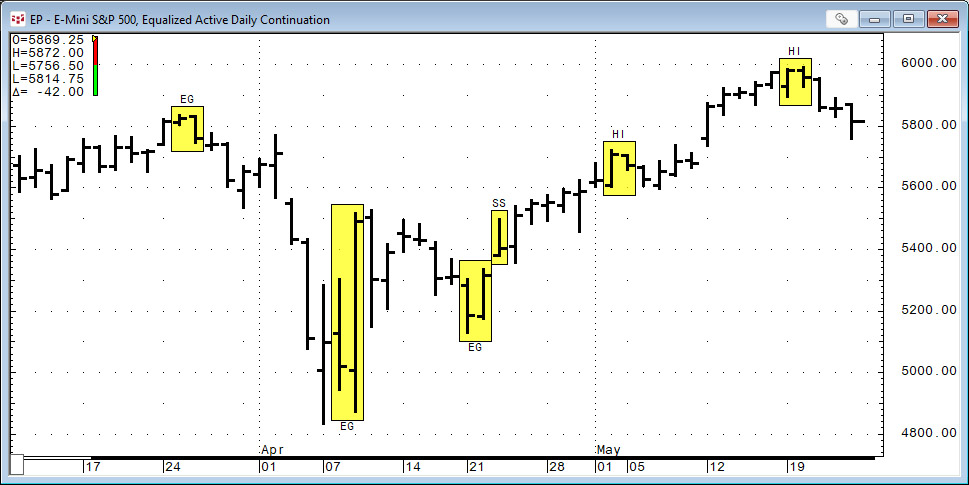
There are 15 Candlestick patterns identified by the study.
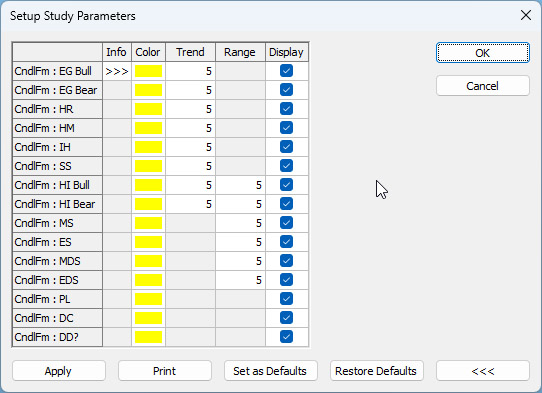
The rules for the conditions are detailed in the Help file.
This post offers a downloadable Excel file that pulls in using RTD formulas the name of the formation when a particular condition is met.
The details of the downloadable spreadsheet is presented.

Column A above has inputs for the Symbol, Time Frame (Chart), Session (All or Primary), Continuation (Equalize Closes), and enter the name of a Custom Session if necessary.
Cells A13 - A15 are checking the tick size of the symbol and setting the formatting of the O, H, L, and C columns using Excel's TEXT function. The prices are automatically formatted to display the correct number of decimals.
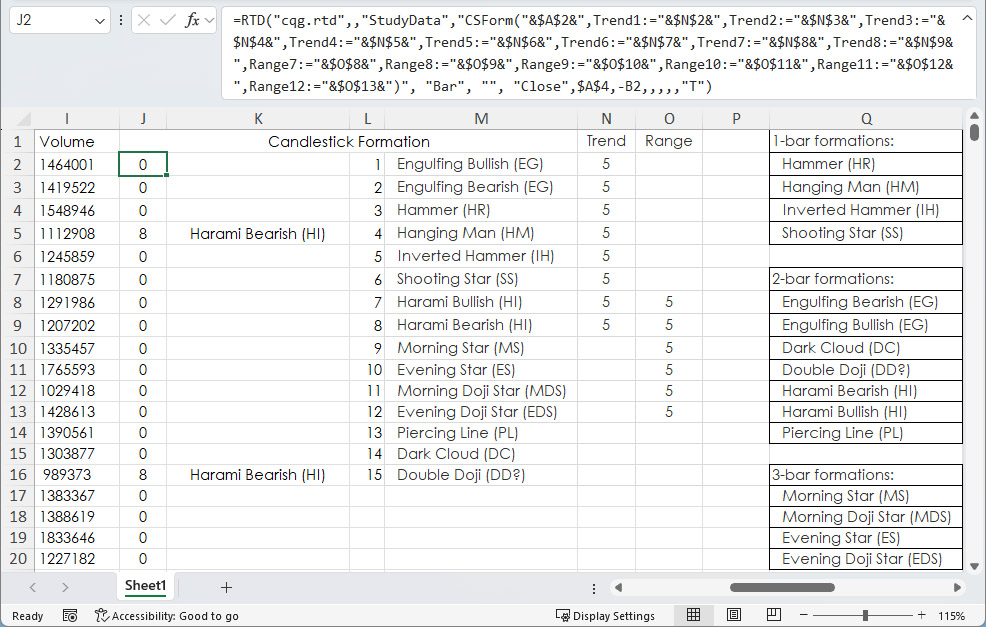
Above, Column J is using the RTD formula for pulling in the Candlestick formation:
=RTD("cqg.rtd",,"StudyData","CSForm("&$A$2&",Trend1:=5,Trend2:=5,Trend3:=5,Trend4:=5,Trend5:=5,Trend6:=5,Trend7:=5,Trend8:=5,Range7:=5,Range8:=5,Range9:=5,Range10:=5,Range11:=5,Range12:=5)", "Bar", "", "Close",$A$4,-B2,,,,,"T")The RTD formula returns an integer, 1 up to 15, identifying the Candlestick formation. The RTD formula above uses a fixed value of 5 for each parameter. The actual RTD formulas used in column J are accessing cells for the Trend (cells N2:N9) and the Range (cells O8:O13) parameters:
=RTD("cqg.rtd",,"StudyData","CSForm("&$A$2&",Trend1:="&$N$2&",Trend2:="&$N$3&",Trend3:="&$N$4&",Trend4:="&$N$5&",Trend5:="&$N$6&",Trend6:="&$N$7&",Trend7:="&$N$8&",Trend8:="&$N$9&",Range7:="&$O$8&",Range8:="&$O$9&",Range9:="&$O$10&",Range10:="&$O$11&",Range11:="&$O$12&",Range12:="&$O$13&")", "Bar", "", "Close",$A$4,-B2,,,,,"T")
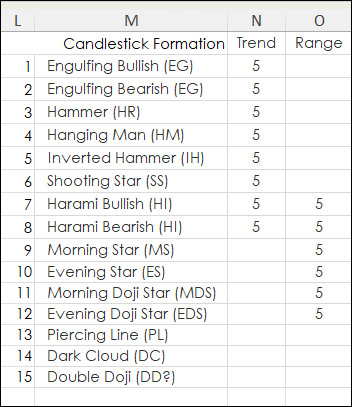
Above, column K uses Excel's VLOOKUP to find in table L2:M16 the number returned in column J and returns the name of the Candlestick pattern.
=IF(J2=0,"",VLOOKUP(J2,$L$2:$M$16,2,FALSE))
Column Q is a key from the help file of the three groups of formations.
The spreadsheet output matches the chart.

Requirements: CQG Integrated Client or QTrader, and Excel 2019 (locally installed, not in the Cloud) or more recent.